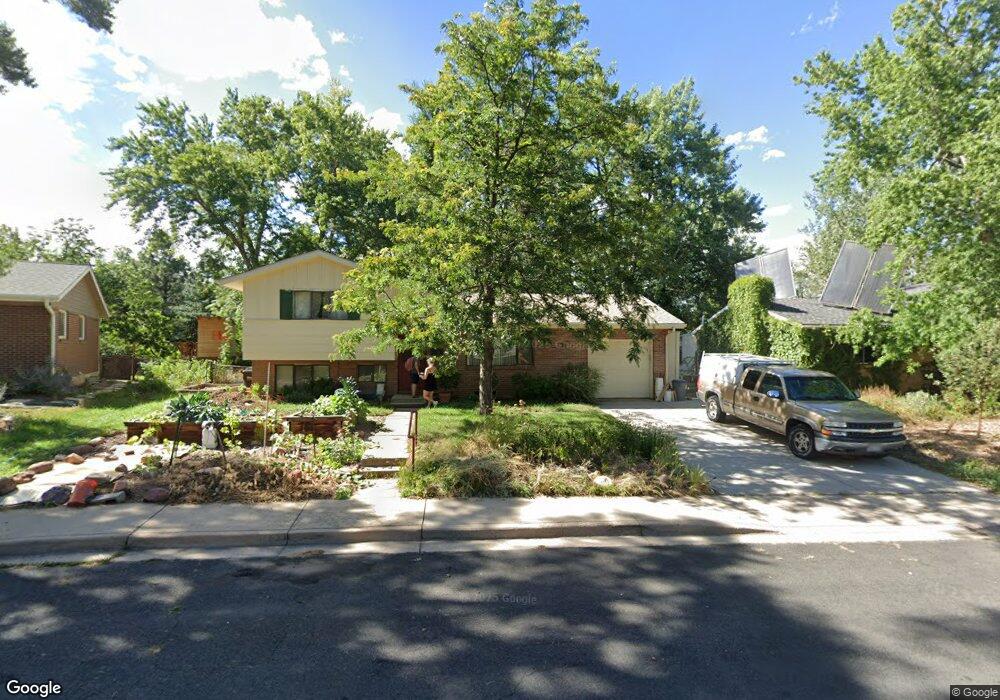
3664 Chase Ct Boulder, CO 80305
South Boulder NeighborhoodEstimated Value: $720,087 - $840,000
3
Beds
2
Baths
1,280
Sq Ft
$627/Sq Ft
Est. Value
About This Home
This home is located at 3664 Chase Ct, Boulder, CO 80305 and is currently estimated at $802,772, approximately $627 per square foot. 3664 Chase Ct is a home located in Boulder County with nearby schools including Creekside Elementary School, Manhattan Middle School of the Arts & Academics, and Fairview High School.
Ownership History
Date
Name
Owned For
Owner Type
Purchase Details
Closed on
Sep 29, 2003
Sold by
Frontczak Susan Marie
Bought by
Susan Marie Frontczak Living Trust
Current Estimated Value
Purchase Details
Closed on
Sep 7, 2001
Sold by
Lugbill Ralph Kent and Boyhan Leslie Anne
Bought by
Frontczak Susan Marie
Home Financials for this Owner
Home Financials are based on the most recent Mortgage that was taken out on this home.
Original Mortgage
$132,000
Interest Rate
6.98%
Purchase Details
Closed on
Jun 8, 2001
Sold by
Nachman Harry S and Nachman Jean M
Bought by
Lugbill Ralph Kent
Home Financials for this Owner
Home Financials are based on the most recent Mortgage that was taken out on this home.
Original Mortgage
$183,950
Interest Rate
7%
Purchase Details
Closed on
Feb 11, 1988
Bought by
Frontczak Susan Marie Living Tst
Purchase Details
Closed on
Nov 16, 1987
Bought by
Frontczak Susan Marie Living Tst
Create a Home Valuation Report for This Property
The Home Valuation Report is an in-depth analysis detailing your home's value as well as a comparison with similar homes in the area
Home Values in the Area
Average Home Value in this Area
Purchase History
| Date | Buyer | Sale Price | Title Company |
|---|---|---|---|
| Susan Marie Frontczak Living Trust | -- | -- | |
| Frontczak Susan Marie | $310,000 | -- | |
| Lugbill Ralph Kent | $283,000 | -- | |
| Frontczak Susan Marie Living Tst | $78,500 | -- | |
| Frontczak Susan Marie Living Tst | $78,500 | -- |
Source: Public Records
Mortgage History
| Date | Status | Borrower | Loan Amount |
|---|---|---|---|
| Closed | Frontczak Susan Marie | $132,000 | |
| Previous Owner | Lugbill Ralph Kent | $183,950 |
Source: Public Records
Tax History Compared to Growth
Tax History
| Year | Tax Paid | Tax Assessment Tax Assessment Total Assessment is a certain percentage of the fair market value that is determined by local assessors to be the total taxable value of land and additions on the property. | Land | Improvement |
|---|---|---|---|---|
| 2025 | $4,126 | $49,407 | $36,619 | $12,788 |
| 2024 | $4,126 | $49,407 | $36,619 | $12,788 |
| 2023 | $4,054 | $53,647 | $43,302 | $14,030 |
| 2022 | $3,563 | $45,321 | $31,949 | $13,372 |
| 2021 | $3,398 | $46,626 | $32,869 | $13,757 |
| 2020 | $3,877 | $44,538 | $27,528 | $17,010 |
| 2019 | $3,817 | $44,538 | $27,528 | $17,010 |
| 2018 | $3,612 | $41,659 | $25,344 | $16,315 |
| 2017 | $3,499 | $46,056 | $28,019 | $18,037 |
| 2016 | $3,222 | $37,221 | $17,273 | $19,948 |
| 2015 | $3,051 | $29,858 | $15,283 | $14,575 |
| 2014 | $2,511 | $29,858 | $15,283 | $14,575 |
Source: Public Records
Map
Nearby Homes
- 3682 Chase Ct
- 3410 Ash Ave
- 325 Fox Ct
- 385 32nd St
- 140 S Lashley Ln
- 4293 Graham Ct
- 450 S 40th St
- 450 S 41st St
- 4255 Apache Rd
- 340 29th St
- 2955 Stanford Ave
- 755 34th St
- 2877 Moorhead Ave
- 325 27th St
- 2585 Kohler Dr
- 15 Pawnee Dr
- 4415 Laguna Place Unit 201
- 725 S 45th St
- 611 Tantra Dr
- 805 29th St Unit 253
- 3662 Chase Ct
- 3666 Chase Ct
- 3660 Berkley Ave
- 3650 Berkley Ave
- 3670 Berkley Ave
- 3658 Chase Ct
- 3640 Berkley Ave
- 3668 Chase Ct
- 3665 Chase Ct
- 3680 Berkley Ave
- 3656 Chase Ct
- 3661 Chase Ct
- 3690 Berkley Ave
- 3672 Chase Ct
- 3630 Berkley Ave
- 3657 Chase Ct
- 3677 Chase Ct
- 3654 Chase Ct
- 3681 Chase Ct
- 3635 Berkley Ave