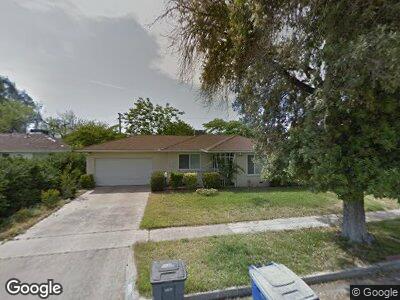
3665 N 8th St Fresno, CA 93726
McLane NeighborhoodEstimated Value: $310,283 - $344,000
3
Beds
2
Baths
1,215
Sq Ft
$271/Sq Ft
Est. Value
About This Home
This home is located at 3665 N 8th St, Fresno, CA 93726 and is currently estimated at $328,821, approximately $270 per square foot. 3665 N 8th St is a home located in Fresno County with nearby schools including Centennial Elementary School, Tioga Middle School, and Herbert Hoover High School.
Ownership History
Date
Name
Owned For
Owner Type
Purchase Details
Closed on
Apr 8, 2010
Sold by
Chau Tran
Bought by
Dang Tim
Current Estimated Value
Home Financials for this Owner
Home Financials are based on the most recent Mortgage that was taken out on this home.
Original Mortgage
$108,000
Outstanding Balance
$73,685
Interest Rate
4.95%
Mortgage Type
New Conventional
Estimated Equity
$254,042
Purchase Details
Closed on
Nov 30, 2009
Sold by
Jpmorgan Chase Bank National Association
Bought by
J L Homes & Investments Inc
Purchase Details
Closed on
Jul 21, 2009
Sold by
Vang Kao and Moua Bao
Bought by
Jpmorgan Chase Bank National Association
Purchase Details
Closed on
Aug 29, 2005
Sold by
Kasparian Joyce Helen
Bought by
Vang Kao and Moua Bao
Home Financials for this Owner
Home Financials are based on the most recent Mortgage that was taken out on this home.
Original Mortgage
$194,400
Interest Rate
5.41%
Mortgage Type
Negative Amortization
Create a Home Valuation Report for This Property
The Home Valuation Report is an in-depth analysis detailing your home's value as well as a comparison with similar homes in the area
Home Values in the Area
Average Home Value in this Area
Purchase History
| Date | Buyer | Sale Price | Title Company |
|---|---|---|---|
| Dang Tim | -- | First American Title Company | |
| Dang Tim | $135,000 | First American Title Company | |
| J L Homes & Investments Inc | $85,000 | Chicago Title Company | |
| Jpmorgan Chase Bank National Association | $67,000 | Accommodation | |
| Vang Kao | $243,000 | Chicago Title Company |
Source: Public Records
Mortgage History
| Date | Status | Borrower | Loan Amount |
|---|---|---|---|
| Open | Dang Tim | $108,000 | |
| Previous Owner | Vang Kao | $194,400 |
Source: Public Records
Tax History Compared to Growth
Tax History
| Year | Tax Paid | Tax Assessment Tax Assessment Total Assessment is a certain percentage of the fair market value that is determined by local assessors to be the total taxable value of land and additions on the property. | Land | Improvement |
|---|---|---|---|---|
| 2023 | $2,054 | $167,486 | $49,623 | $117,863 |
| 2022 | $2,024 | $164,202 | $48,650 | $115,552 |
| 2021 | $1,967 | $160,984 | $47,697 | $113,287 |
| 2020 | $1,958 | $159,334 | $47,208 | $112,126 |
| 2019 | $1,881 | $156,211 | $46,283 | $109,928 |
| 2018 | $1,839 | $153,149 | $45,376 | $107,773 |
| 2017 | $1,806 | $150,147 | $44,487 | $105,660 |
| 2016 | $1,745 | $147,204 | $43,615 | $103,589 |
| 2015 | $1,717 | $144,993 | $42,960 | $102,033 |
| 2014 | $1,684 | $142,154 | $42,119 | $100,035 |
Source: Public Records
Map
Nearby Homes
- 3852 E Dakota Ave
- 3907 E Dayton Ave
- 4003 E Fedora Ave
- 3948 E Fedora Ave
- 4002 E Dakota Ave
- 4115 E Dayton Ave
- 3752 E Saginaw Way
- 3926 E Fountain Way
- 3757 E Farrin Ave
- 3135 N Spalding Ave
- 2934 N 8th St
- 4438 E Dakota Ave
- 3845 E Princeton Ave
- 3512 E Simpson Ave
- 3774 E Austin Way
- 4233 E Buckingham Way
- 4321 E Buckingham Way
- 3023 E Robinson Ave
- 3004 N First St
- 3328 E Ashlan Ave