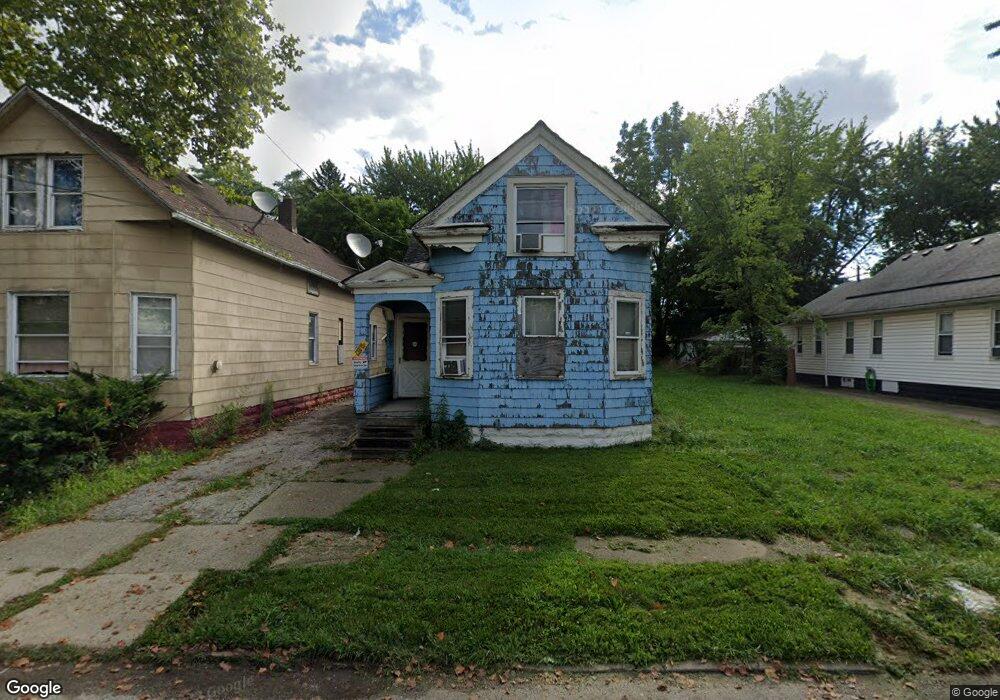
3669 E 50th St Cleveland, OH 44105
Slavic Village NeighborhoodEstimated Value: $53,000 - $72,000
2
Beds
1
Bath
790
Sq Ft
$75/Sq Ft
Est. Value
About This Home
This home is located at 3669 E 50th St, Cleveland, OH 44105 and is currently estimated at $59,604, approximately $75 per square foot. 3669 E 50th St is a home located in Cuyahoga County with nearby schools including Anton Grdina School, Andrew J. Rickoff School, and Bolton.
Ownership History
Date
Name
Owned For
Owner Type
Purchase Details
Closed on
Jul 20, 2010
Sold by
Northeast Property Specialists Llc
Bought by
Stansberry Gail
Current Estimated Value
Purchase Details
Closed on
Mar 31, 2008
Sold by
Aurora Loan Services Llc
Bought by
Northeast Property Specialists Llc
Purchase Details
Closed on
Aug 6, 2007
Sold by
Porrello Raymond A and Porrello Sharon A
Bought by
Aurora Loan Services Llc
Purchase Details
Closed on
Mar 10, 2004
Sold by
Thailing Eric Joseph
Bought by
Porrello Raymond A
Purchase Details
Closed on
Jul 13, 1989
Sold by
Thailing William and Thailing William J
Bought by
Thailing Eric Joseph
Purchase Details
Closed on
Sep 7, 1977
Sold by
Murdock Jerry D
Bought by
Thailing William J
Purchase Details
Closed on
Aug 18, 1976
Sold by
Derbin Rita
Bought by
Murdock Jerry D
Purchase Details
Closed on
Apr 30, 1976
Sold by
Srnka Rose A
Bought by
Derbin Rita
Purchase Details
Closed on
Jan 1, 1975
Bought by
Srnka Rose A
Create a Home Valuation Report for This Property
The Home Valuation Report is an in-depth analysis detailing your home's value as well as a comparison with similar homes in the area
Home Values in the Area
Average Home Value in this Area
Purchase History
| Date | Buyer | Sale Price | Title Company |
|---|---|---|---|
| Stansberry Gail | -- | Attorney | |
| Northeast Property Specialists Llc | $6,250 | Prism Title & Closing Servic | |
| Aurora Loan Services Llc | $20,000 | None Available | |
| Porrello Raymond A | $30,000 | Suntrust Title Agency | |
| Thailing Eric Joseph | -- | -- | |
| Thailing William J | $16,000 | -- | |
| Murdock Jerry D | $11,300 | -- | |
| Derbin Rita | -- | -- | |
| Srnka Rose A | -- | -- |
Source: Public Records
Tax History Compared to Growth
Tax History
| Year | Tax Paid | Tax Assessment Tax Assessment Total Assessment is a certain percentage of the fair market value that is determined by local assessors to be the total taxable value of land and additions on the property. | Land | Improvement |
|---|---|---|---|---|
| 2024 | $855 | $12,775 | $3,745 | $9,030 |
| 2023 | $598 | $7,710 | $2,630 | $5,080 |
| 2022 | $594 | $7,700 | $2,625 | $5,075 |
| 2021 | $589 | $7,700 | $2,630 | $5,080 |
| 2020 | $597 | $6,760 | $2,310 | $4,450 |
| 2019 | $850 | $19,300 | $6,600 | $12,700 |
| 2018 | $572 | $6,760 | $2,310 | $4,450 |
| 2017 | $598 | $7,070 | $1,470 | $5,600 |
| 2016 | $593 | $7,070 | $1,470 | $5,600 |
| 2015 | $2,582 | $7,070 | $1,470 | $5,600 |
| 2014 | $2,582 | $7,070 | $1,470 | $5,600 |
Source: Public Records
Map
Nearby Homes
- 3716 E 52nd St
- 3716 E 50th St
- 3721 E 50th St
- 3660 E 53rd St
- 3677 E 53rd St
- 3671 E 57th St
- 3799 E 54th St
- 3831 E 50th St
- 3719 E 57th St
- 3558 E 46th St
- 3629 E 57th St
- 3601 E 57th St
- 3819 E 54th St
- 3569 Independence Rd
- 3806 E 57th St
- 3821 E 55th St
- 5806 Fleet Ave
- 3566 Sykora Rd
- 3472 E 52nd St
- 3517 E 44th St
- 3665 E 50th St
- 3671 E 50th St
- 3675 E 50th St
- 3663 E 50th St
- 3677 E 50th St
- 3659 E 50th St
- 3681 E 50th St
- 3655 E 50th St
- 3664 E 50th St
- 3683 E 50th St
- 3666 E 52nd St
- 3670 E 52nd St
- 3664 E 52nd St
- 3674 E 52nd St
- 3656 Kirkham Ave
- 3668 E 50th St
- 3672 E 50th St
- 3660 E 50th St
- 3662 E 50th St
- 3674 E 50th St