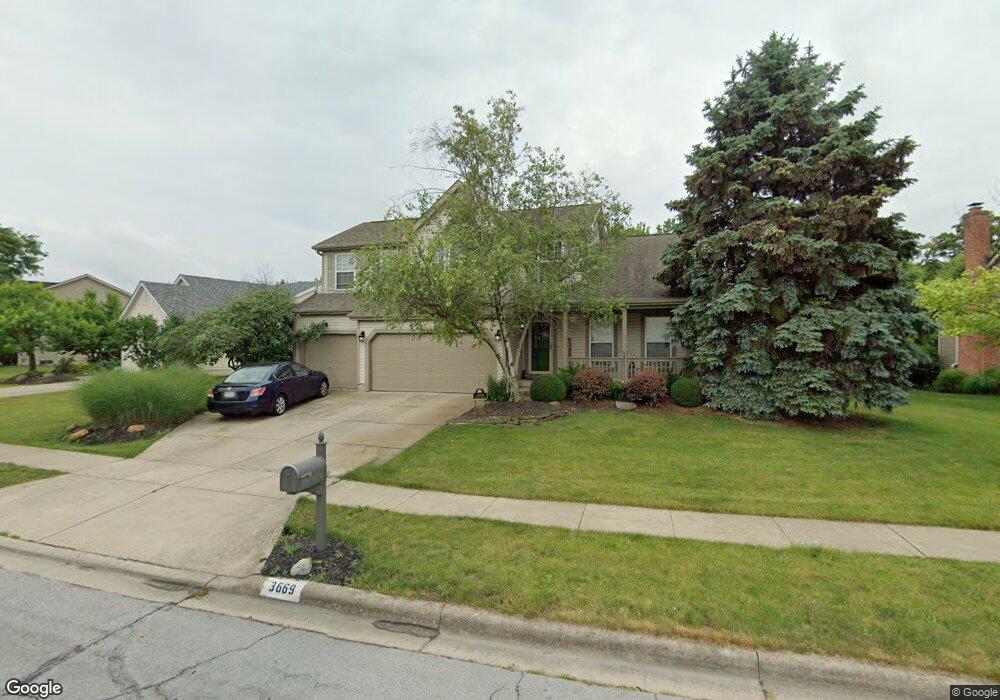
3669 Newell Dr Columbus, OH 43228
Scioto Woods NeighborhoodEstimated Value: $482,000 - $505,000
3
Beds
4
Baths
2,428
Sq Ft
$202/Sq Ft
Est. Value
About This Home
This home is located at 3669 Newell Dr, Columbus, OH 43228 and is currently estimated at $490,711, approximately $202 per square foot. 3669 Newell Dr is a home located in Franklin County with nearby schools including Beacon Elementary School, Hilliard Tharp Sixth Grade Elementary School, and Hilliard Weaver Middle School.
Ownership History
Date
Name
Owned For
Owner Type
Purchase Details
Closed on
May 19, 2021
Sold by
Gardner Kenneth J
Bought by
Gardner Christina L
Current Estimated Value
Purchase Details
Closed on
May 1, 2009
Sold by
Gardner Christina L and Gardner Kenneth J
Bought by
Gardner Christina L and Gardner Kenneth J
Purchase Details
Closed on
Mar 30, 2006
Sold by
Fogle Candace A and Candace A Fogle Revocable Trus
Bought by
Stischok Christina L
Home Financials for this Owner
Home Financials are based on the most recent Mortgage that was taken out on this home.
Original Mortgage
$145,000
Outstanding Balance
$82,305
Interest Rate
6.34%
Mortgage Type
Fannie Mae Freddie Mac
Estimated Equity
$408,406
Purchase Details
Closed on
Apr 2, 2002
Sold by
Fogle Candace A
Bought by
Fogle Candace A and The Candace A Fogle Revocable
Purchase Details
Closed on
Jan 27, 1993
Bought by
Fogle Candace A
Purchase Details
Closed on
Dec 10, 1992
Create a Home Valuation Report for This Property
The Home Valuation Report is an in-depth analysis detailing your home's value as well as a comparison with similar homes in the area
Home Values in the Area
Average Home Value in this Area
Purchase History
| Date | Buyer | Sale Price | Title Company |
|---|---|---|---|
| Gardner Christina L | -- | None Available | |
| Gardner Christina L | -- | Attorney | |
| Stischok Christina L | $245,000 | Title First | |
| Fogle Candace A | -- | -- | |
| Fogle Candace A | $163,100 | -- | |
| -- | -- | -- |
Source: Public Records
Mortgage History
| Date | Status | Borrower | Loan Amount |
|---|---|---|---|
| Open | Stischok Christina L | $145,000 |
Source: Public Records
Tax History Compared to Growth
Tax History
| Year | Tax Paid | Tax Assessment Tax Assessment Total Assessment is a certain percentage of the fair market value that is determined by local assessors to be the total taxable value of land and additions on the property. | Land | Improvement |
|---|---|---|---|---|
| 2024 | $8,295 | $146,870 | $47,780 | $99,090 |
| 2023 | $7,186 | $146,860 | $47,775 | $99,085 |
| 2022 | $7,070 | $115,710 | $18,270 | $97,440 |
| 2021 | $7,063 | $115,710 | $18,270 | $97,440 |
| 2020 | $7,044 | $115,710 | $18,270 | $97,440 |
| 2019 | $6,537 | $91,700 | $14,630 | $77,070 |
| 2018 | $5,913 | $91,700 | $14,630 | $77,070 |
| 2017 | $6,091 | $91,700 | $14,630 | $77,070 |
| 2016 | $5,672 | $74,000 | $14,390 | $59,610 |
| 2015 | $5,316 | $74,000 | $14,390 | $59,610 |
| 2014 | $5,326 | $74,000 | $14,390 | $59,610 |
| 2013 | $2,698 | $73,990 | $14,385 | $59,605 |
Source: Public Records
Map
Nearby Homes
- 3664 Grimes Dr
- 3495 La Coste Ln
- 3757 Gibbstone Dr
- 3761 Gibbstone Dr
- 4000 Sandy Ridge Dr
- 3570 Dover Rd
- 3254 Dover Rd
- 3252 Dover Rd
- 2051 Tuckaway Ct
- 3161 Bowdoin Cir
- 1150 Romona Place
- 0 Lowell Dr Unit 223009270
- 2754 Scioto Station Dr
- 2704 Scioto Station Dr Unit 2704
- 3307 Rudon Ln
- 2875 Lowell Dr
- 2350 Hetter St
- 664 N Wilson Rd
- 2867 Kobuk Dr Unit 404
- 2867 Kobuk Dr Unit 304
- 3663 Newell Dr
- 3675 Newell Dr
- 3657 Newell Dr
- 3683 Newell Dr
- 1540 Whitcombe Way
- 3660 Newell Dr
- 3680 Newell Dr
- 3652 Newell Dr
- 3651 Newell Dr
- 3688 Newell Dr
- 1500 Weiskopf Dr
- 1480 Beman Ct
- 1466 Beman Ct
- 1548 Whitcombe Way
- 3645 Newell Dr
- 1525 Weiskopf Dr
- 1452 Beman Ct
- 1545 Whitcombe Way
- 3634 Newell Dr
- 1537 Weiskopf Dr