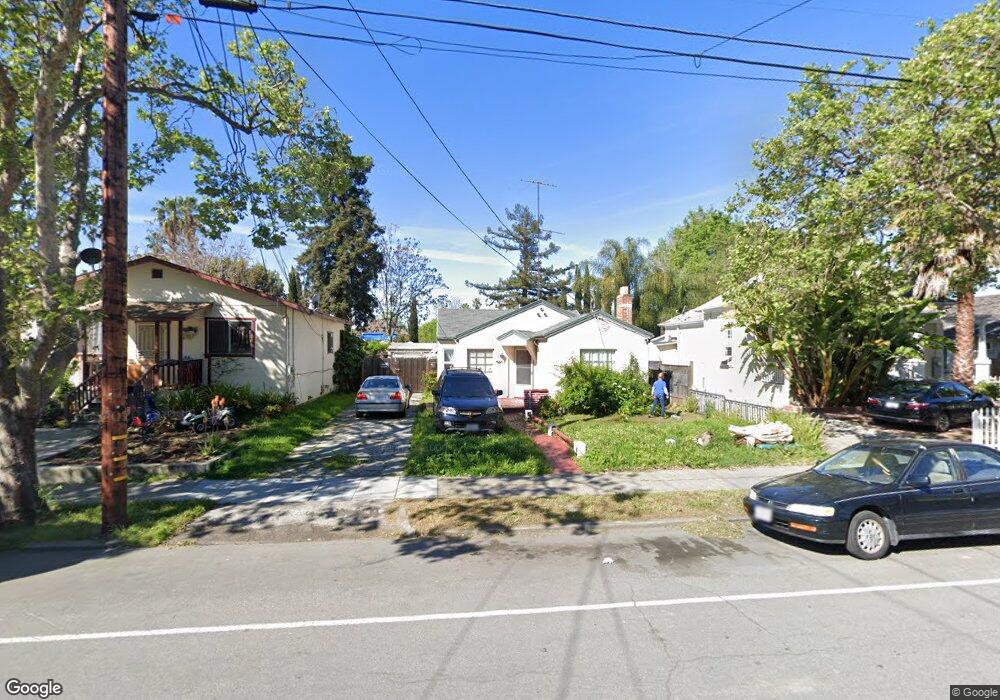
367 N 10th St San Jose, CA 95112
Northside NeighborhoodEstimated Value: $901,000 - $1,132,000
2
Beds
1
Bath
1,121
Sq Ft
$889/Sq Ft
Est. Value
About This Home
This home is located at 367 N 10th St, San Jose, CA 95112 and is currently estimated at $996,659, approximately $889 per square foot. 367 N 10th St is a home located in Santa Clara County with nearby schools including Grant Elementary School, Muwekma Ohlone Middle, and San Jose High School.
Ownership History
Date
Name
Owned For
Owner Type
Purchase Details
Closed on
Apr 1, 2020
Sold by
Nguyen Le and City Of San Jose
Bought by
Park Place Investment Llc
Current Estimated Value
Purchase Details
Closed on
Dec 5, 2019
Sold by
Nguyen Le and City Of San Jose
Bought by
Park Place Investment Llc
Purchase Details
Closed on
Sep 18, 1998
Sold by
Dufour Katherine M
Bought by
Le Nga
Home Financials for this Owner
Home Financials are based on the most recent Mortgage that was taken out on this home.
Original Mortgage
$164,000
Interest Rate
6.88%
Create a Home Valuation Report for This Property
The Home Valuation Report is an in-depth analysis detailing your home's value as well as a comparison with similar homes in the area
Home Values in the Area
Average Home Value in this Area
Purchase History
| Date | Buyer | Sale Price | Title Company |
|---|---|---|---|
| Park Place Investment Llc | -- | None Available | |
| Park Place Investment Llc | -- | None Available | |
| Le Nga | $219,000 | North American Title Co |
Source: Public Records
Mortgage History
| Date | Status | Borrower | Loan Amount |
|---|---|---|---|
| Previous Owner | Le Nga | $164,000 |
Source: Public Records
Tax History
| Year | Tax Paid | Tax Assessment Tax Assessment Total Assessment is a certain percentage of the fair market value that is determined by local assessors to be the total taxable value of land and additions on the property. | Land | Improvement |
|---|---|---|---|---|
| 2025 | $12,660 | $984,277 | $634,312 | $349,965 |
| 2024 | $12,660 | $964,978 | $621,875 | $343,103 |
| 2023 | $12,420 | $946,058 | $609,682 | $336,376 |
| 2022 | $12,314 | $927,509 | $597,728 | $329,781 |
| 2021 | $12,064 | $909,323 | $586,008 | $323,315 |
| 2020 | $5,037 | $319,427 | $250,853 | $68,574 |
| 2019 | $4,912 | $313,165 | $245,935 | $67,230 |
| 2018 | $4,847 | $307,025 | $241,113 | $65,912 |
| 2017 | $4,797 | $301,006 | $236,386 | $64,620 |
| 2016 | $4,647 | $295,104 | $231,751 | $63,353 |
| 2015 | $4,606 | $290,672 | $228,270 | $62,402 |
| 2014 | $4,179 | $284,979 | $223,799 | $61,180 |
Source: Public Records
Map
Nearby Homes
- 361 N 10th St
- 362 N 7th St
- 436 N 12th St
- 401 N 13th St
- 436 N 7th St
- 417 E Saint James St
- 196 N 9th St
- 305 E Empire St
- 403 N 15th St
- 431 E Saint John St
- 915 E Julian St
- 309 N 5th St
- 623 & 625 S 2nd St
- 333 & 335 N 4th St
- 614 N 12th St
- 97 E Saint James St Unit 21
- 97 E Saint James St Unit 26
- 415 N 2nd St Unit 245
- 415 N 2nd St Unit 344
- 558 N 3rd St
Your Personal Tour Guide
Ask me questions while you tour the home.