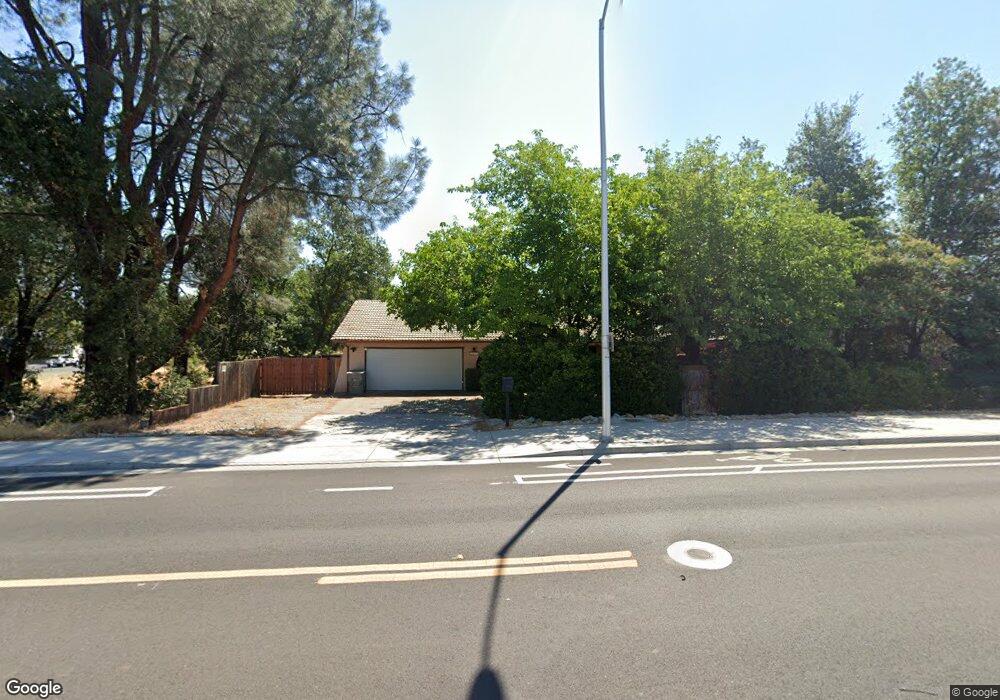
3673 Bechelli Ln Unit 1 Redding, CA 96002
South Bechelli NeighborhoodEstimated Value: $321,000 - $369,000
3
Beds
2
Baths
1,620
Sq Ft
$213/Sq Ft
Est. Value
About This Home
This home is located at 3673 Bechelli Ln Unit 1, Redding, CA 96002 and is currently estimated at $344,767, approximately $212 per square foot. 3673 Bechelli Ln Unit 1 is a home located in Shasta County with nearby schools including Lassen View Elementary School, Parsons Junior High School, and Enterprise High School.
Ownership History
Date
Name
Owned For
Owner Type
Purchase Details
Closed on
Oct 12, 2009
Sold by
Gmac Mortgage Llc
Bought by
Walters Randall and Walters Yen
Current Estimated Value
Home Financials for this Owner
Home Financials are based on the most recent Mortgage that was taken out on this home.
Original Mortgage
$134,850
Outstanding Balance
$87,695
Interest Rate
5%
Mortgage Type
New Conventional
Estimated Equity
$257,072
Purchase Details
Closed on
Sep 18, 2009
Sold by
Johann Bruce E and Johann Tomiko F
Bought by
Gmac Mortgage Llc
Home Financials for this Owner
Home Financials are based on the most recent Mortgage that was taken out on this home.
Original Mortgage
$134,850
Outstanding Balance
$87,695
Interest Rate
5%
Mortgage Type
New Conventional
Estimated Equity
$257,072
Purchase Details
Closed on
Mar 24, 1999
Sold by
Tikkanen James A and Tikkanen Yolanda
Bought by
Johann Bruce E and Johann Tomiko F
Home Financials for this Owner
Home Financials are based on the most recent Mortgage that was taken out on this home.
Original Mortgage
$89,862
Interest Rate
6.73%
Mortgage Type
FHA
Create a Home Valuation Report for This Property
The Home Valuation Report is an in-depth analysis detailing your home's value as well as a comparison with similar homes in the area
Home Values in the Area
Average Home Value in this Area
Purchase History
| Date | Buyer | Sale Price | Title Company |
|---|---|---|---|
| Walters Randall | $150,000 | Fidelity National Title Co | |
| Gmac Mortgage Llc | $152,150 | None Available | |
| Johann Bruce E | $90,000 | Redding Title Company |
Source: Public Records
Mortgage History
| Date | Status | Borrower | Loan Amount |
|---|---|---|---|
| Open | Walters Randall | $134,850 | |
| Previous Owner | Johann Bruce E | $89,862 | |
| Closed | Johann Bruce E | $4,500 |
Source: Public Records
Tax History
| Year | Tax Paid | Tax Assessment Tax Assessment Total Assessment is a certain percentage of the fair market value that is determined by local assessors to be the total taxable value of land and additions on the property. | Land | Improvement |
|---|---|---|---|---|
| 2025 | $2,041 | $193,606 | $64,533 | $129,073 |
| 2024 | $2,011 | $189,811 | $63,268 | $126,543 |
| 2023 | $2,011 | $186,090 | $62,028 | $124,062 |
| 2022 | $1,953 | $182,442 | $60,812 | $121,630 |
| 2021 | $1,885 | $178,866 | $59,620 | $119,246 |
| 2020 | $1,876 | $177,033 | $59,009 | $118,024 |
| 2019 | $1,859 | $173,562 | $57,852 | $115,710 |
| 2018 | $1,836 | $170,160 | $56,718 | $113,442 |
| 2017 | $1,867 | $166,824 | $55,606 | $111,218 |
| 2016 | $1,745 | $163,554 | $54,516 | $109,038 |
| 2015 | $1,730 | $161,099 | $53,698 | $107,401 |
| 2014 | $1,716 | $157,945 | $52,647 | $105,298 |
Source: Public Records
Map
Nearby Homes
- 3650 Cheryl Dr
- 3689 Suzanne Way
- 3708 Traverse St
- 688 Julie Way
- 737 Estate St
- 1209 C St
- 1108 4th St
- 3527 Adams Ln
- 3428 Adams Ln
- 3087 Northwoods Way
- 607 Woodacre Dr
- 1091 Del Sol Place
- 1075 Le Brun Ln
- 751 Woodacre Dr
- 3081 Henderson Rd
- 2935 Shotwick Trail
- 1354 Harpole Rd
- 3425 Riverview Dr
- 890 Parsons Dr
- 918 Parsons Dr
- 3673 Bechelli Ln
- 3691 Bechelli Ln
- 550 Terrace Dr
- 3643 Bechelli Ln Unit 3645
- 544 Terrace Dr
- 3711 Bechelli Ln
- 3615 Bechelli Ln
- 558 Terrace Dr
- 3613 Bechelli Ln
- 538 Terrace Dr
- 3642 Bechelli Ln
- 3678 Bechelli Ln
- 3609 Bechelli Ln
- 514 Estate St
- 574 Terrace Dr
- 565 Terrace Dr
- 3618 Bechelli Ln
- 532 Estate St
- 3645 Bechelli Ln
- 3710 Bechelli Ln
Your Personal Tour Guide
Ask me questions while you tour the home.