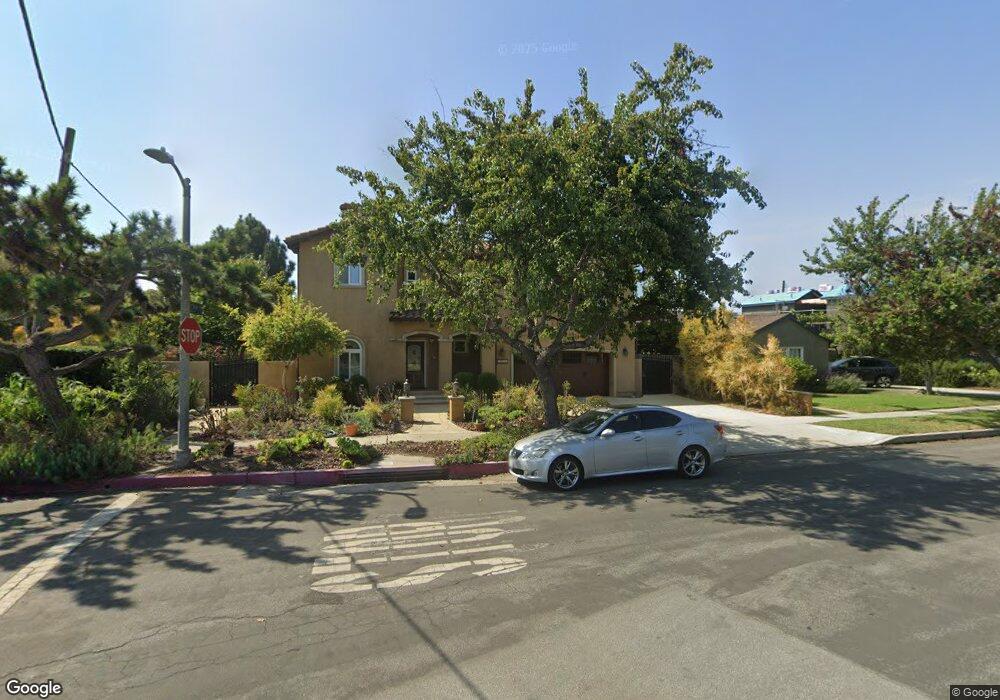
3679 Berryman Ave Los Angeles, CA 90066
Mar Vista NeighborhoodEstimated Value: $1,856,000 - $2,984,000
4
Beds
3
Baths
2,880
Sq Ft
$889/Sq Ft
Est. Value
About This Home
This home is located at 3679 Berryman Ave, Los Angeles, CA 90066 and is currently estimated at $2,559,956, approximately $888 per square foot. 3679 Berryman Ave is a home located in Los Angeles County with nearby schools including Grand View Boulevard Elementary School, Daniel Webster Middle School, and Venice High School.
Ownership History
Date
Name
Owned For
Owner Type
Purchase Details
Closed on
Aug 27, 2015
Sold by
Lee Guang Huei and Lee Ruby
Bought by
The Guang Huei & Ruby Lee Revocable Fami
Current Estimated Value
Purchase Details
Closed on
May 27, 2010
Sold by
Chao Irene Min Li
Bought by
Lee Ruby and Ruby Lee Revocable Trust
Purchase Details
Closed on
Oct 22, 2005
Sold by
Chao David Te Whe and Chao Michelle Mei Hsien
Bought by
Chao Irene Min Li
Purchase Details
Closed on
Feb 8, 2005
Sold by
Shen Jennifer Ying Ying
Bought by
Chao Irene Min Li
Purchase Details
Closed on
Oct 20, 2001
Sold by
Chao David Te Whe and Chao Michelle Mei Hsien
Bought by
Chao Irene Min Li
Purchase Details
Closed on
Aug 12, 2001
Sold by
Chao David Te Whe and Shen Jennifer Ying Ying
Bought by
Chao David Te Whe and Sh En Jennifer Ying Ying
Purchase Details
Closed on
Jul 14, 2000
Sold by
Chiang Ching Ping
Bought by
Chao David Te Whe
Create a Home Valuation Report for This Property
The Home Valuation Report is an in-depth analysis detailing your home's value as well as a comparison with similar homes in the area
Home Values in the Area
Average Home Value in this Area
Purchase History
| Date | Buyer | Sale Price | Title Company |
|---|---|---|---|
| The Guang Huei & Ruby Lee Revocable Fami | -- | None Available | |
| Lee Guang Huei | -- | None Available | |
| Lee Ruby | -- | None Available | |
| Chao Irene Min Li | -- | -- | |
| Chao Irene Min Li | -- | -- | |
| Chao Irene Min Li | -- | -- | |
| Chao David Te Whe | -- | -- | |
| Chao David Te Whe | -- | -- |
Source: Public Records
Tax History Compared to Growth
Tax History
| Year | Tax Paid | Tax Assessment Tax Assessment Total Assessment is a certain percentage of the fair market value that is determined by local assessors to be the total taxable value of land and additions on the property. | Land | Improvement |
|---|---|---|---|---|
| 2025 | $13,659 | $1,132,295 | $647,870 | $484,425 |
| 2024 | $13,659 | $1,110,094 | $635,167 | $474,927 |
| 2023 | $13,398 | $1,088,328 | $622,713 | $465,615 |
| 2022 | $12,781 | $1,066,989 | $610,503 | $456,486 |
| 2021 | $12,613 | $1,046,069 | $598,533 | $447,536 |
| 2019 | $12,235 | $1,015,044 | $580,781 | $434,263 |
| 2018 | $12,139 | $995,143 | $569,394 | $425,749 |
| 2016 | $11,594 | $956,502 | $547,285 | $409,217 |
| 2015 | $11,425 | $942,136 | $539,065 | $403,071 |
| 2014 | $11,463 | $923,682 | $528,506 | $395,176 |
Source: Public Records
Map
Nearby Homes
- 11622 Charnock Rd
- 11419 Charnock Rd
- 3743 Mclaughlin Ave
- 11510 Venice Blvd
- 3601 Mclaughlin Ave
- 3667 Sawtelle Blvd
- 11702 Charnock Rd
- 3833 Coolidge Ave
- 11316 Venice Blvd
- 0 Sawtelle Blvd
- 3765 Globe Ave
- 3818 Sawtelle Blvd
- 3491 Butler Ave
- 11523 Vienna Way
- 11856 Venice Blvd
- 3910 Mclaughlin Ave
- 11286 Westminster Ave Unit 101
- 11957 Modjeska Place
- 3938 East Blvd
- 3973 Coolidge Ave
- 3673 Berryman Ave
- 3667 Berryman Ave
- 11504 Victoria Ave
- 11500 Victoria Ave
- 3676 Berryman Ave
- 11448 Victoria Ave
- 11440 Victoria Ave
- 3661 Berryman Ave
- 3670 Berryman Ave
- 3658 Coolidge Ave
- 3654 Coolidge Ave
- 3664 Berryman Ave
- 11526 Victoria Ave
- 11485 Biona Dr
- 11436 Victoria Ave
- 3713 Butler Ave
- 3648 Coolidge Ave
- 11423 Victoria Ave
- 3658 Berryman Ave
- 11428 Victoria Ave