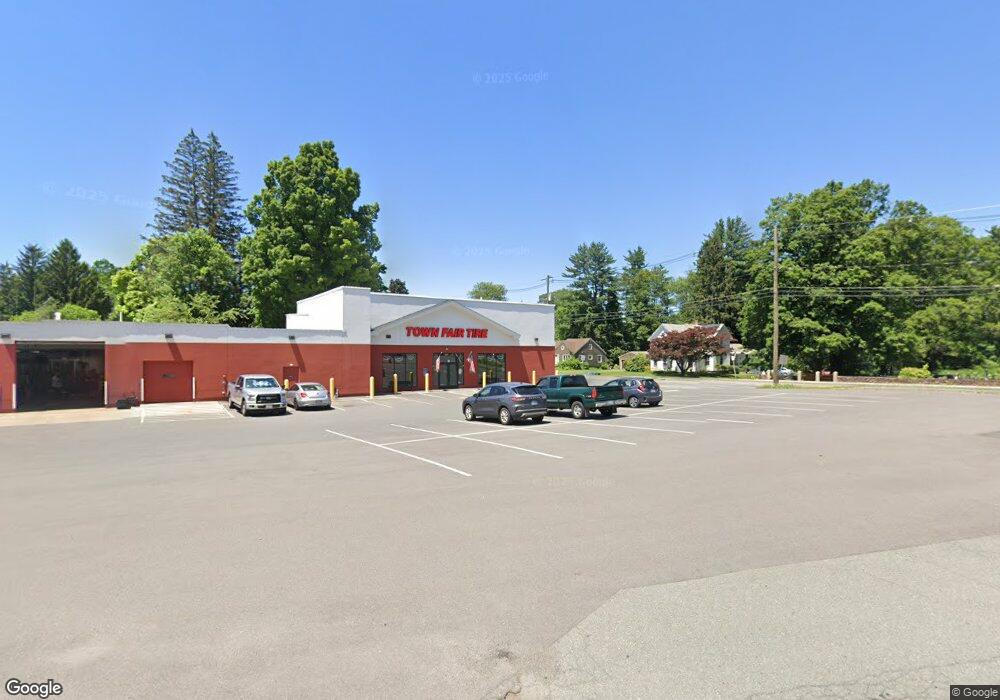
368 High St Greenfield, MA 01301
Estimated Value: $260,298
Studio
2
Baths
2,000
Sq Ft
$130/Sq Ft
Est. Value
About This Home
This home is located at 368 High St, Greenfield, MA 01301 and is currently priced at $260,298, approximately $130 per square foot. 368 High St is a home located in Franklin County with nearby schools including Holy Trinity School, Cornerstone Christian School, and Greenfield Center School.
Ownership History
Date
Name
Owned For
Owner Type
Purchase Details
Closed on
Apr 4, 2023
Sold by
368 High Street Llc
Bought by
Town Fair Tire Ctrs Of Ma
Current Estimated Value
Purchase Details
Closed on
Jan 4, 2010
Sold by
Lafleur James P
Bought by
368 High Street Llc
Purchase Details
Closed on
Dec 31, 2009
Sold by
Butternut Realty Llc
Bought by
Lafleur James P
Purchase Details
Closed on
Dec 2, 2005
Sold by
Chitoff Stanley G
Bought by
Butternut Rlty Llc
Home Financials for this Owner
Home Financials are based on the most recent Mortgage that was taken out on this home.
Original Mortgage
$350,000
Interest Rate
6.14%
Mortgage Type
Commercial
Create a Home Valuation Report for This Property
The Home Valuation Report is an in-depth analysis detailing your home's value as well as a comparison with similar homes in the area
Home Values in the Area
Average Home Value in this Area
Purchase History
| Date | Buyer | Sale Price | Title Company |
|---|---|---|---|
| Town Fair Tire Ctrs Of Ma | $236,000 | None Available | |
| 368 High Street Llc | -- | -- | |
| Lafleur James P | -- | -- | |
| Butternut Rlty Llc | $350,000 | -- |
Source: Public Records
Mortgage History
| Date | Status | Borrower | Loan Amount |
|---|---|---|---|
| Previous Owner | Butternut Rlty Llc | $350,000 |
Source: Public Records
Tax History
| Year | Tax Paid | Tax Assessment Tax Assessment Total Assessment is a certain percentage of the fair market value that is determined by local assessors to be the total taxable value of land and additions on the property. | Land | Improvement |
|---|---|---|---|---|
| 2024 | $5,405 | $265,100 | $146,000 | $119,100 |
| 2023 | $4,854 | $247,000 | $132,600 | $114,400 |
| 2022 | $5,285 | $236,800 | $126,400 | $110,400 |
| 2021 | $5,540 | $238,600 | $124,500 | $114,100 |
| 2020 | $5,473 | $238,700 | $124,500 | $114,200 |
| 2019 | $5,340 | $238,800 | $124,500 | $114,300 |
| 2018 | $4,885 | $217,800 | $116,400 | $101,400 |
| 2017 | $4,733 | $217,800 | $116,400 | $101,400 |
| 2016 | $4,687 | $214,900 | $116,400 | $98,500 |
| 2015 | $4,759 | $211,400 | $116,400 | $95,000 |
| 2014 | $4,225 | $205,800 | $116,400 | $89,400 |
Source: Public Records
Map
Nearby Homes
- 372 Federal St
- 335 Federal St
- 37 Cleveland St
- 132 Poplar St
- 93 Maple St
- 696 Bernardston Rd
- 52 Canada Hill Rd
- 709 Fairway Ave
- 12 Leonard St
- 805 Fairway Ave
- 8 Country Club Ln
- 173-175 Conway St
- 89 Columbus Ave
- 6 Pickett Ln
- 59-61 Conway St
- 0 Millers Falls Rd Unit 73034825
- 11 Conway St
- 4 Pickett Ln
- 36 West St
- 63 James St
Your Personal Tour Guide
Ask me questions while you tour the home.