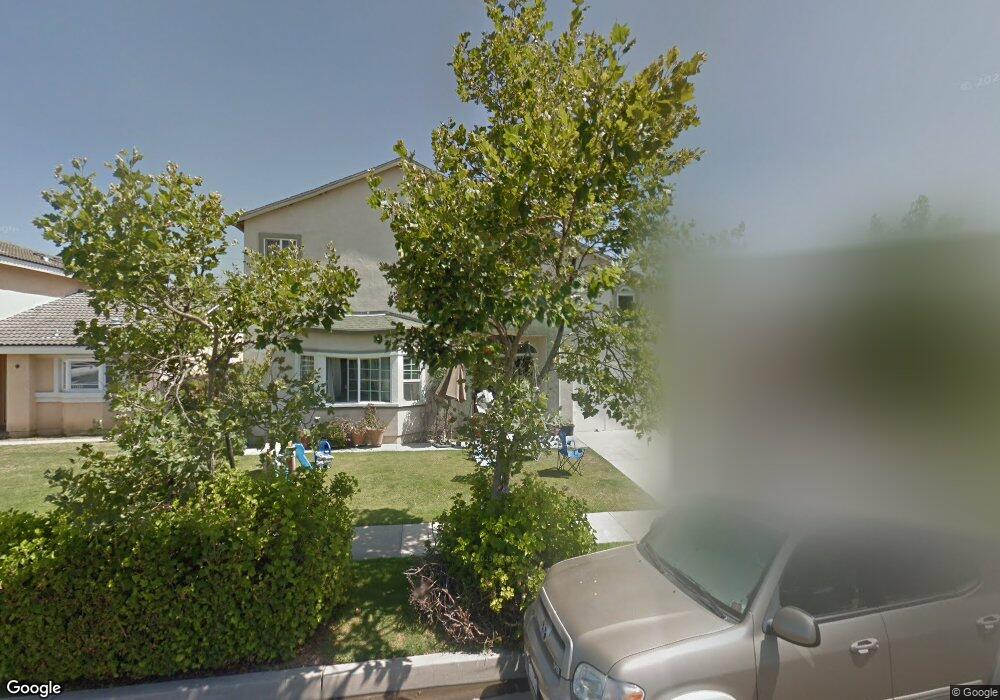
3681 Vista de Ora Los Alamitos, CA 90720
Estimated Value: $1,525,097 - $1,782,000
5
Beds
3
Baths
2,673
Sq Ft
$622/Sq Ft
Est. Value
About This Home
This home is located at 3681 Vista de Ora, Los Alamitos, CA 90720 and is currently estimated at $1,661,274, approximately $621 per square foot. 3681 Vista de Ora is a home located in Orange County with nearby schools including Rossmoor Elementary School, Jack L. Weaver Elementary School, and Oak Middle School.
Ownership History
Date
Name
Owned For
Owner Type
Purchase Details
Closed on
Feb 12, 2025
Sold by
Born Andrew V
Bought by
Born Family Trust and Born
Current Estimated Value
Purchase Details
Closed on
Jul 21, 1998
Sold by
Born Lisa
Bought by
Born Andrew
Home Financials for this Owner
Home Financials are based on the most recent Mortgage that was taken out on this home.
Original Mortgage
$205,600
Interest Rate
6.9%
Purchase Details
Closed on
Sep 3, 1996
Sold by
John Kennedy and John Marilyn L
Bought by
Kennedy John J and Kennedy Marilyn L
Purchase Details
Closed on
Dec 17, 1993
Sold by
Kennedy Marilyn
Bought by
Kennedy John J
Home Financials for this Owner
Home Financials are based on the most recent Mortgage that was taken out on this home.
Original Mortgage
$162,500
Interest Rate
7.2%
Create a Home Valuation Report for This Property
The Home Valuation Report is an in-depth analysis detailing your home's value as well as a comparison with similar homes in the area
Home Values in the Area
Average Home Value in this Area
Purchase History
| Date | Buyer | Sale Price | Title Company |
|---|---|---|---|
| Born Family Trust | -- | None Listed On Document | |
| Born Andrew | -- | Southland Title Corporation | |
| Born Andrew | $257,000 | Southland Title Corporation | |
| Kennedy John J | -- | -- | |
| Kennedy John J | -- | Commonwealth Land Title |
Source: Public Records
Mortgage History
| Date | Status | Borrower | Loan Amount |
|---|---|---|---|
| Previous Owner | Born Andrew | $205,600 | |
| Previous Owner | Kennedy John J | $162,500 |
Source: Public Records
Tax History Compared to Growth
Tax History
| Year | Tax Paid | Tax Assessment Tax Assessment Total Assessment is a certain percentage of the fair market value that is determined by local assessors to be the total taxable value of land and additions on the property. | Land | Improvement |
|---|---|---|---|---|
| 2025 | $2,890 | $212,666 | $36,017 | $176,649 |
| 2024 | $2,890 | $208,497 | $35,311 | $173,186 |
| 2023 | $2,816 | $204,409 | $34,618 | $169,791 |
| 2022 | $2,789 | $200,401 | $33,939 | $166,462 |
| 2021 | $2,726 | $196,472 | $33,273 | $163,199 |
| 2020 | $2,722 | $194,458 | $32,932 | $161,526 |
| 2019 | $2,631 | $190,646 | $32,287 | $158,359 |
| 2018 | $2,497 | $186,908 | $31,654 | $155,254 |
| 2017 | $2,442 | $183,244 | $31,034 | $152,210 |
| 2016 | $2,392 | $179,651 | $30,425 | $149,226 |
| 2015 | $2,358 | $176,953 | $29,968 | $146,985 |
| 2014 | $2,277 | $173,487 | $29,381 | $144,106 |
Source: Public Records
Map
Nearby Homes
- 3701 La Colmena Way
- 11862 Paseo Bonita
- 3391 Rossmoor Way
- 3361 Rossmoor Way
- 3311 Rossmoor Way
- 3312 Kenilworth Dr
- 3362 Saint Albans Dr
- 3845 Farquhar Ave Unit 110
- 3802 Howard Ave
- 3804 Howard Ave
- 3272 Saint Albans Dr
- 12111 Reagan St
- 3342 Bradbury Rd Unit 34
- 11385 Baskerville Rd
- 12100 Montecito Rd Unit 49
- 12278 Bridgewater Way
- 12200 Montecito Rd Unit K201
- 12200 Montecito Rd
- 12200 Montecito Rd Unit A205
- 12200 Montecito Rd Unit C103
- 3701 Vista de Ora
- 3671 Vista de Ora
- 3711 Vista de Ora
- 11632 Reagan St
- 3702 La Colmena Way
- 3672 La Colmena Way
- 3712 La Colmena Way
- 3662 La Colmena Way
- 3682 Vista de Ora
- 3702 Vista de Ora
- 3672 Vista de Ora
- 3721 Vista de Ora
- 3662 Vista de Ora
- 3712 Vista de Ora
- 3722 La Colmena Way
- 11631 Reagan St
- 11641 Reagan St
- 11682 Reagan St
- 3722 Vista de Ora
- 3731 Vista de Ora