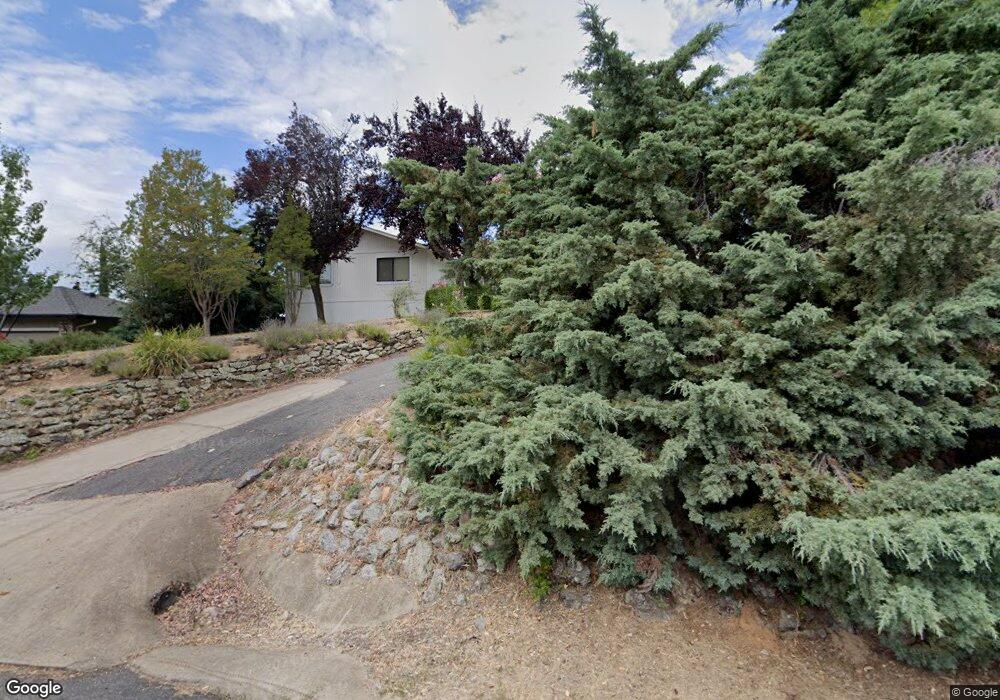
3684 Kimberly Rd Cameron Park, CA 95682
Estimated Value: $630,232 - $661,000
3
Beds
3
Baths
2,198
Sq Ft
$293/Sq Ft
Est. Value
About This Home
This home is located at 3684 Kimberly Rd, Cameron Park, CA 95682 and is currently estimated at $644,308, approximately $293 per square foot. 3684 Kimberly Rd is a home located in El Dorado County with nearby schools including Camerado Springs Middle School, Ponderosa High School, and Buckeye Union Mandarin Immersion Charter School.
Ownership History
Date
Name
Owned For
Owner Type
Purchase Details
Closed on
Feb 25, 2004
Sold by
Procissi Wayne L and Procissi Barbara L
Bought by
Mitchell Larry and Mitchell Belinda
Current Estimated Value
Home Financials for this Owner
Home Financials are based on the most recent Mortgage that was taken out on this home.
Original Mortgage
$340,100
Outstanding Balance
$141,555
Interest Rate
4.12%
Mortgage Type
Purchase Money Mortgage
Estimated Equity
$502,753
Purchase Details
Closed on
Jan 15, 1999
Sold by
Singleton Lewis J Tr and Singleton Betty J Tr Etal
Bought by
Procissi Wayne L and Procissi Barbara L
Home Financials for this Owner
Home Financials are based on the most recent Mortgage that was taken out on this home.
Original Mortgage
$151,200
Interest Rate
6.66%
Create a Home Valuation Report for This Property
The Home Valuation Report is an in-depth analysis detailing your home's value as well as a comparison with similar homes in the area
Home Values in the Area
Average Home Value in this Area
Purchase History
| Date | Buyer | Sale Price | Title Company |
|---|---|---|---|
| Mitchell Larry | $358,000 | Fidelity Natl Title Co | |
| Procissi Wayne L | $168,000 | Chicago Title Co |
Source: Public Records
Mortgage History
| Date | Status | Borrower | Loan Amount |
|---|---|---|---|
| Open | Mitchell Larry | $340,100 | |
| Previous Owner | Procissi Wayne L | $151,200 |
Source: Public Records
Tax History
| Year | Tax Paid | Tax Assessment Tax Assessment Total Assessment is a certain percentage of the fair market value that is determined by local assessors to be the total taxable value of land and additions on the property. | Land | Improvement |
|---|---|---|---|---|
| 2025 | $5,332 | $508,975 | $106,621 | $402,354 |
| 2024 | $5,332 | $498,996 | $104,531 | $394,465 |
| 2023 | $5,230 | $489,213 | $102,482 | $386,731 |
| 2022 | $5,153 | $479,622 | $100,473 | $379,149 |
| 2021 | $5,086 | $470,218 | $98,503 | $371,715 |
| 2020 | $5,018 | $465,397 | $97,493 | $367,904 |
| 2019 | $4,933 | $456,273 | $95,582 | $360,691 |
| 2018 | $4,803 | $447,327 | $93,708 | $353,619 |
| 2017 | $4,705 | $438,557 | $91,871 | $346,686 |
| 2016 | $4,274 | $395,500 | $83,000 | $312,500 |
| 2015 | $3,291 | $351,500 | $73,500 | $278,000 |
| 2014 | $3,291 | $303,000 | $63,500 | $239,500 |
Source: Public Records
Map
Nearby Homes
- 3691 Hampton Ln
- 3708 Millbrae Rd
- 3831 Sheridan Rd
- 2779 Osborne Rd
- 3098 Oakwood Rd
- 2886 Knollwood Dr
- 2406 Knollwood Dr
- 3002 Tri Ln
- 2575 Meadow Ln Unit 8
- 2780 Holly Hills Ln
- 3060 Knollwood Dr
- 3569 Cambridge Rd
- 2515 Merrychase Dr Unit K
- 2515 Merrychase Dr Unit F
- 3590 Montclair Rd
- 3300 Woodleigh Ln
- 3341 Rancho Tierra Ct
- 7137 Cinnamon Teal Way
- 3937 Rustic Rd
- 3788 Hillsborough Rd
- 3690 Kimberly Rd
- 3678 Kimberly Rd
- 3705 Hampton Ln
- 3699 Hampton Ln
- 3715 Hampton Ln
- 3685 Kimberly Rd
- 3700 Kimberly Rd
- 2728 Wentworth Rd
- 3695 Kimberly Rd
- 2742 Wentworth Rd
- 3719 Hampton Ln
- 2720 Wentworth Rd
- 3701 Kimberly Rd
- 2748 Wentworth Rd
- 2712 Wentworth Rd
- 3708 Kimberly Rd
- 3731 Hampton Ln
- 3706 Hampton Ln
- 3700 Hampton Ln
- 2700 Wentworth Rd
Your Personal Tour Guide
Ask me questions while you tour the home.