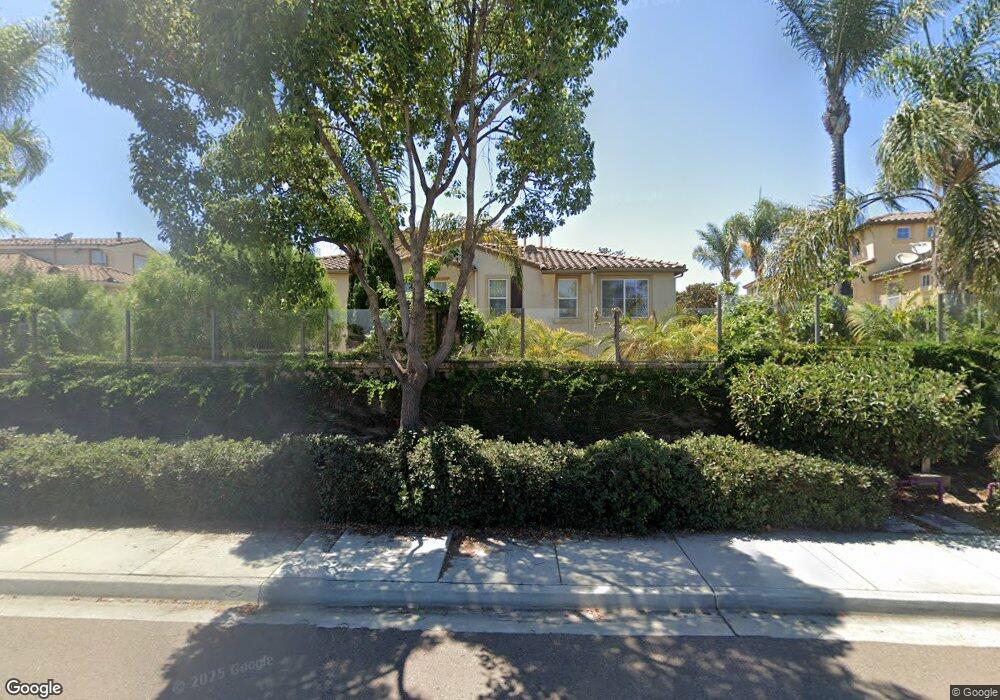
3689 Jetty Point Carlsbad, CA 92010
Calavera Hills NeighborhoodEstimated Value: $797,085 - $941,000
3
Beds
3
Baths
1,502
Sq Ft
$585/Sq Ft
Est. Value
About This Home
This home is located at 3689 Jetty Point, Carlsbad, CA 92010 and is currently estimated at $878,521, approximately $584 per square foot. 3689 Jetty Point is a home located in San Diego County with nearby schools including Hope Elementary School, Calavera Hills Middle, and Sage Creek High.
Ownership History
Date
Name
Owned For
Owner Type
Purchase Details
Closed on
Oct 18, 2017
Sold by
Johnson Robert T and Johnson Linda P
Bought by
Johnson Robert T and Johnson Linda P
Current Estimated Value
Purchase Details
Closed on
Nov 11, 2011
Sold by
Salgado Amparo E
Bought by
Johnson Robert T and Johnson Linda P
Purchase Details
Closed on
Apr 28, 2006
Sold by
Bowes Darren S and Bowes Jenny M
Bought by
Salgado Amparo E
Home Financials for this Owner
Home Financials are based on the most recent Mortgage that was taken out on this home.
Original Mortgage
$120,000
Interest Rate
12.62%
Mortgage Type
Credit Line Revolving
Purchase Details
Closed on
Aug 30, 2004
Sold by
Cal E1 Llc
Bought by
Bowes Darren S and Bowes Jenny M
Home Financials for this Owner
Home Financials are based on the most recent Mortgage that was taken out on this home.
Original Mortgage
$353,360
Interest Rate
5.37%
Mortgage Type
Purchase Money Mortgage
Create a Home Valuation Report for This Property
The Home Valuation Report is an in-depth analysis detailing your home's value as well as a comparison with similar homes in the area
Home Values in the Area
Average Home Value in this Area
Purchase History
| Date | Buyer | Sale Price | Title Company |
|---|---|---|---|
| Johnson Robert T | -- | None Available | |
| Johnson Robert T | $323,000 | Fidelity National Title | |
| Salgado Amparo E | $535,000 | First American Title Co | |
| Bowes Darren S | $442,000 | First American Title |
Source: Public Records
Mortgage History
| Date | Status | Borrower | Loan Amount |
|---|---|---|---|
| Previous Owner | Salgado Amparo E | $120,000 | |
| Previous Owner | Salgado Amparo E | $415,000 | |
| Previous Owner | Bowes Darren S | $353,360 | |
| Closed | Bowes Darren S | $66,255 |
Source: Public Records
Tax History Compared to Growth
Tax History
| Year | Tax Paid | Tax Assessment Tax Assessment Total Assessment is a certain percentage of the fair market value that is determined by local assessors to be the total taxable value of land and additions on the property. | Land | Improvement |
|---|---|---|---|---|
| 2025 | $5,657 | $405,695 | $251,206 | $154,489 |
| 2024 | $5,657 | $397,741 | $246,281 | $151,460 |
| 2023 | $5,638 | $389,943 | $241,452 | $148,491 |
| 2022 | $5,570 | $382,298 | $236,718 | $145,580 |
| 2021 | $5,771 | $374,803 | $232,077 | $142,726 |
| 2020 | $5,737 | $370,961 | $229,698 | $141,263 |
| 2019 | $5,662 | $363,689 | $225,195 | $138,494 |
| 2018 | $5,498 | $356,559 | $220,780 | $135,779 |
| 2017 | $90 | $349,568 | $216,451 | $133,117 |
| 2016 | $5,275 | $342,714 | $212,207 | $130,507 |
| 2015 | $5,260 | $337,567 | $209,020 | $128,547 |
| 2014 | $5,195 | $330,955 | $204,926 | $126,029 |
Source: Public Records
Map
Nearby Homes
- 2935 Cliff Cir Unit 33
- 2992 Lexington Cir
- 2835 Hillsboro Ct
- 3019 Glenbrook St
- 3618 Milford Place
- 2754 Inverness Dr
- 2755 Victoria Ave
- 4375 Stanford St
- 3840 Stoneridge Rd
- 3304 Telaga Rd
- 3545 Knollwood Dr
- 3072 Marron Rd
- 4060 Alto St
- 4459 Dorchester Place
- 2543 Glasgow Dr
- 2591 Regent Rd Unit 52
- 4847 Nelson Ct
- 4225 Dusk Ln
- 3456 Thunder Dr
- 3686 Harvard Dr
- 3685 Jetty Point
- 3683 Jetty Point Unit 31
- 3695 Jetty Point
- 3681 Jetty Point
- 3675 Jetty Point
- 3697 Jetty Point Unit 34
- 3677 Jetty Point
- 3684 Jetty Point
- 3691 Jetty Point
- 3693 Jetty Point Unit 38
- 3673 Jetty Point
- 3699 Jetty Point Unit 36
- 3676 Jetty Point Unit 76
- 3669 Jetty Point Unit 27
- 3682 Jetty Point Unit 80
- 3686 Jetty Point Unit 81
- 3678 Jetty Point
- 3674 Jetty Point Unit 78
- 3668 Jetty Point
- 3703 Jetty Point