
Landlord's Agent in 2023
Ilona Kuphal
Compass
(617) 592-2310
15 Total Sales

Estimated Value: $940,787 - $1,175,000
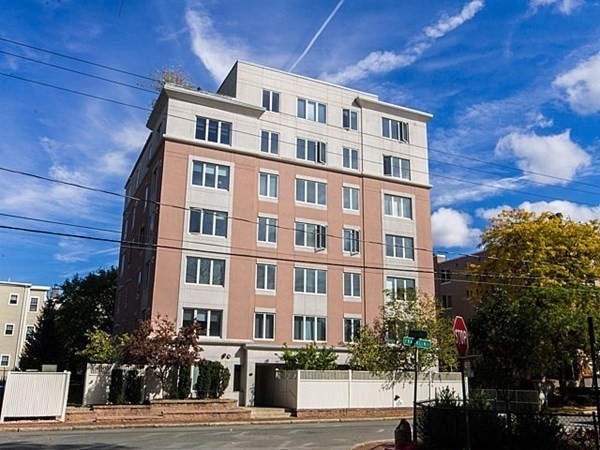
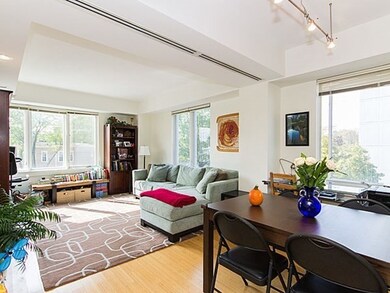
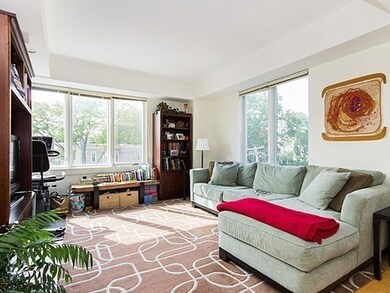
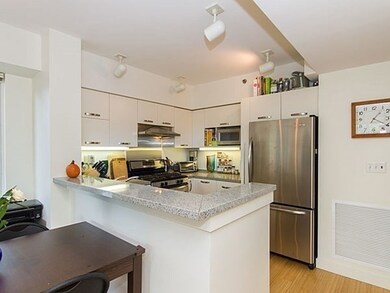
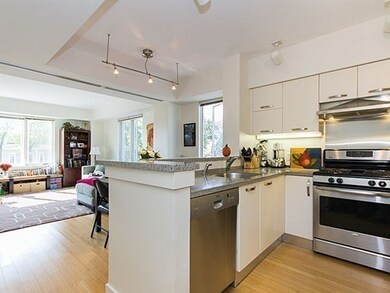
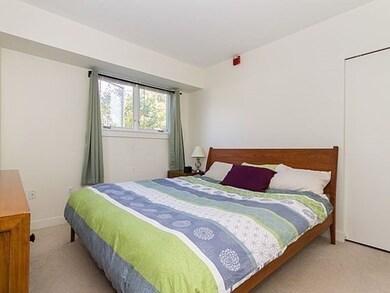
Seldom does a rental in this European-designed, energy-efficient, new elevator condo building (2003) come on the market. This bright and airy 2BR, 1.5 BA apt. features an Open-Living-Space with oversized windows and bamboo floors. The kitchen offers SS appliances,, a Bosh dishwasher, granite counters and cabinets with hidden compartments.. A vestibule connects the master bedroom to the bath, Some of the building amenities include garage parking w/ heated driveway, small penthouse fitness room with balcony and a large common yard with patio for grilling and enjoyment. Located on a quiet street but close to the hustle and bustle of Central Square; its restaurants, cafes, shops and public transportation (Red Line, Buses) are in walking distance. Easy access to: Highway, Harvard Square, Harvard, MIT, BU, the Charles River and downtown Boston.
| Date | Event | Price | List to Sale | Price per Sq Ft | Prior Sale |
|---|---|---|---|---|---|
| 09/01/2023 09/01/23 | Rented | $3,900 | +8.3% | -- | |
| 07/27/2023 07/27/23 | Under Contract | -- | -- | -- | |
| 07/23/2023 07/23/23 | For Rent | $3,600 | +10.8% | -- | |
| 01/01/2022 01/01/22 | Rented | -- | -- | -- | |
| 11/30/2021 11/30/21 | Under Contract | -- | -- | -- | |
| 11/15/2021 11/15/21 | For Rent | $3,250 | +1.6% | -- | |
| 06/14/2020 06/14/20 | Rented | $3,200 | 0.0% | -- | |
| 06/06/2020 06/06/20 | Under Contract | -- | -- | -- | |
| 06/03/2020 06/03/20 | For Rent | $3,200 | 0.0% | -- | |
| 07/01/2019 07/01/19 | Rented | $3,200 | 0.0% | -- | |
| 06/12/2019 06/12/19 | Under Contract | -- | -- | -- | |
| 06/03/2019 06/03/19 | For Rent | $3,200 | +3.2% | -- | |
| 07/01/2017 07/01/17 | Rented | $3,100 | 0.0% | -- | |
| 05/30/2017 05/30/17 | Under Contract | -- | -- | -- | |
| 05/18/2017 05/18/17 | For Rent | $3,100 | +3.3% | -- | |
| 11/23/2016 11/23/16 | Under Contract | -- | -- | -- | |
| 11/22/2016 11/22/16 | Rented | $3,000 | 0.0% | -- | |
| 10/14/2016 10/14/16 | For Rent | $3,000 | 0.0% | -- | |
| 09/03/2014 09/03/14 | Rented | $3,000 | 0.0% | -- | |
| 09/03/2014 09/03/14 | For Rent | $3,000 | +7.1% | -- | |
| 03/01/2012 03/01/12 | Rented | $2,800 | 0.0% | -- | |
| 02/08/2012 02/08/12 | Sold | $482,500 | 0.0% | $513 / Sq Ft | View Prior Sale |
| 01/31/2012 01/31/12 | Under Contract | -- | -- | -- | |
| 01/18/2012 01/18/12 | For Rent | $2,800 | 0.0% | -- | |
| 12/19/2011 12/19/11 | Pending | -- | -- | -- | |
| 11/28/2011 11/28/11 | For Sale | $499,000 | -- | $531 / Sq Ft |
| Year | Tax Paid | Tax Assessment Tax Assessment Total Assessment is a certain percentage of the fair market value that is determined by local assessors to be the total taxable value of land and additions on the property. | Land | Improvement |
|---|---|---|---|---|
| 2025 | $5,710 | $899,200 | $0 | $899,200 |
| 2024 | $5,183 | $875,500 | $0 | $875,500 |
| 2023 | $5,054 | $862,500 | $0 | $862,500 |
| 2022 | $5,003 | $845,100 | $0 | $845,100 |
| 2021 | $4,823 | $824,500 | $0 | $824,500 |
| 2020 | $4,640 | $807,000 | $0 | $807,000 |
| 2019 | $4,458 | $750,500 | $0 | $750,500 |
| 2018 | $4,346 | $690,900 | $0 | $690,900 |
| 2017 | $4,136 | $637,300 | $0 | $637,300 |
| 2016 | $3,983 | $569,800 | $0 | $569,800 |
| 2015 | $3,952 | $505,400 | $0 | $505,400 |
| 2014 | $3,913 | $467,000 | $0 | $467,000 |
Landlord's Agent in 2023
Ilona Kuphal
Compass
(617) 592-2310
15 Total Sales
J
Tenant's Agent in 2023
Joseph Maiorana
Keller Williams Realty Boston-Metro | Back Bay
4 Total Sales
Buyer's Agent in 2022
Jason Barenholtz
Century 21 Shawmut Properties
(617) 817-4187
3 Total Sales
C
Buyer's Agent in 2020
Coleman Group
William Raveis R.E. & Home Services
(617) 642-0205
1 in this area
276 Total Sales
Buyer's Agent in 2017
Susan Piracini
Compass
(781) 475-2475
60 Total Sales
M
Buyer's Agent in 2016
Monic D Alcantara
Gibson Sothebys International Realty
(617) 426-6900
8 Total Sales
Source: MLS Property Information Network (MLS PIN)
MLS Number: 73139687
APN: CAMB-000119-000000-000113-000401
Disclaimer: Certain information contained herein is derived from information provided by parties other than Homes.com. All information provided is deemed reliable, but is not guaranteed to be accurate and should be independently verified.
![]() The property listing data and information, or the Images, set forth herein were provided to MLS Property Information Network, Inc. from third party sources, including sellers, lessors and public records, and were compiled by MLS Property Information Network, Inc. The property listing data and information, and the Images, are for the personal, non-commercial use of consumers having a good faith interest in purchasing or leasing listed properties of the type displayed to them and may not be used for any purpose other than to identify prospective properties which such consumers may have a good faith interest in purchasing or leasing. MLS Property Information Network, Inc. and its subscribers disclaim any and all representations and warranties as to the accuracy of the property listing data and information, or as to the accuracy of any of the Images, set forth herein.
The property listing data and information, or the Images, set forth herein were provided to MLS Property Information Network, Inc. from third party sources, including sellers, lessors and public records, and were compiled by MLS Property Information Network, Inc. The property listing data and information, and the Images, are for the personal, non-commercial use of consumers having a good faith interest in purchasing or leasing listed properties of the type displayed to them and may not be used for any purpose other than to identify prospective properties which such consumers may have a good faith interest in purchasing or leasing. MLS Property Information Network, Inc. and its subscribers disclaim any and all representations and warranties as to the accuracy of the property listing data and information, or as to the accuracy of any of the Images, set forth herein.