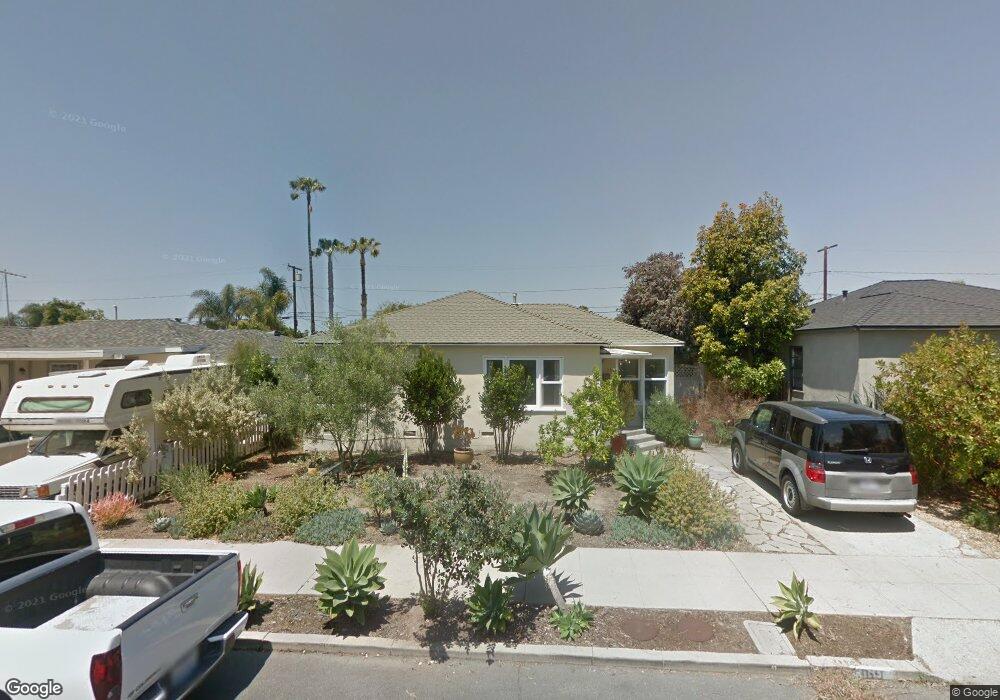
369 Jones St Ventura, CA 93003
Midtown NeighborhoodEstimated Value: $832,000 - $871,000
2
Beds
1
Bath
960
Sq Ft
$889/Sq Ft
Est. Value
About This Home
This home is located at 369 Jones St, Ventura, CA 93003 and is currently estimated at $853,132, approximately $888 per square foot. 369 Jones St is a home located in Ventura County with nearby schools including Will Rogers Elementary School, Cabrillo Middle School, and Ventura High School.
Ownership History
Date
Name
Owned For
Owner Type
Purchase Details
Closed on
May 7, 2009
Sold by
Schlobohm Curtis
Bought by
Garnett Gretchen Claire
Current Estimated Value
Home Financials for this Owner
Home Financials are based on the most recent Mortgage that was taken out on this home.
Original Mortgage
$302,625
Outstanding Balance
$190,896
Interest Rate
4.82%
Mortgage Type
Purchase Money Mortgage
Estimated Equity
$662,236
Create a Home Valuation Report for This Property
The Home Valuation Report is an in-depth analysis detailing your home's value as well as a comparison with similar homes in the area
Home Values in the Area
Average Home Value in this Area
Purchase History
| Date | Buyer | Sale Price | Title Company |
|---|---|---|---|
| Garnett Gretchen Claire | $403,500 | First American Title Company |
Source: Public Records
Mortgage History
| Date | Status | Borrower | Loan Amount |
|---|---|---|---|
| Open | Garnett Gretchen Claire | $302,625 |
Source: Public Records
Tax History
| Year | Tax Paid | Tax Assessment Tax Assessment Total Assessment is a certain percentage of the fair market value that is determined by local assessors to be the total taxable value of land and additions on the property. | Land | Improvement |
|---|---|---|---|---|
| 2025 | $5,583 | $519,598 | $363,788 | $155,810 |
| 2024 | $5,583 | $509,410 | $356,655 | $152,755 |
| 2023 | $5,514 | $499,422 | $349,662 | $149,760 |
| 2022 | $5,135 | $489,630 | $342,806 | $146,824 |
| 2021 | $5,036 | $480,030 | $336,084 | $143,946 |
| 2020 | $4,987 | $475,110 | $332,639 | $142,471 |
| 2019 | $4,894 | $465,795 | $326,117 | $139,678 |
| 2018 | $4,812 | $456,663 | $319,723 | $136,940 |
| 2017 | $4,709 | $447,709 | $313,454 | $134,255 |
| 2016 | $4,617 | $438,931 | $307,308 | $131,623 |
| 2015 | $4,567 | $432,340 | $302,693 | $129,647 |
| 2014 | $4,491 | $423,872 | $296,764 | $127,108 |
Source: Public Records
Map
Nearby Homes
- 386 Howard St
- 2679 Preble Ave
- 400 Frances St
- 2378 Channel Dr Unit 103
- 2378 Channel Dr Unit 105
- 330 S Seaward Ave
- 431 Eva St
- 2352 Channel Dr Unit 104
- 2352 Channel Dr Unit 101
- 2352 Channel Dr Unit 105
- 2742 Sereno Ave
- 2392 Haley Point Dr Unit 104
- 2380 Haley Point Dr Unit 104
- 2364 Haley Point Dr Unit 103
- 2364 Haley Point Dr Unit 101
- 2324 Channel Dr Unit 105
- 215 Coronado St
- 519 S Emma Ave
- 2543 E Harbor Blvd Unit 1
- 417 Anacapa St
Your Personal Tour Guide
Ask me questions while you tour the home.