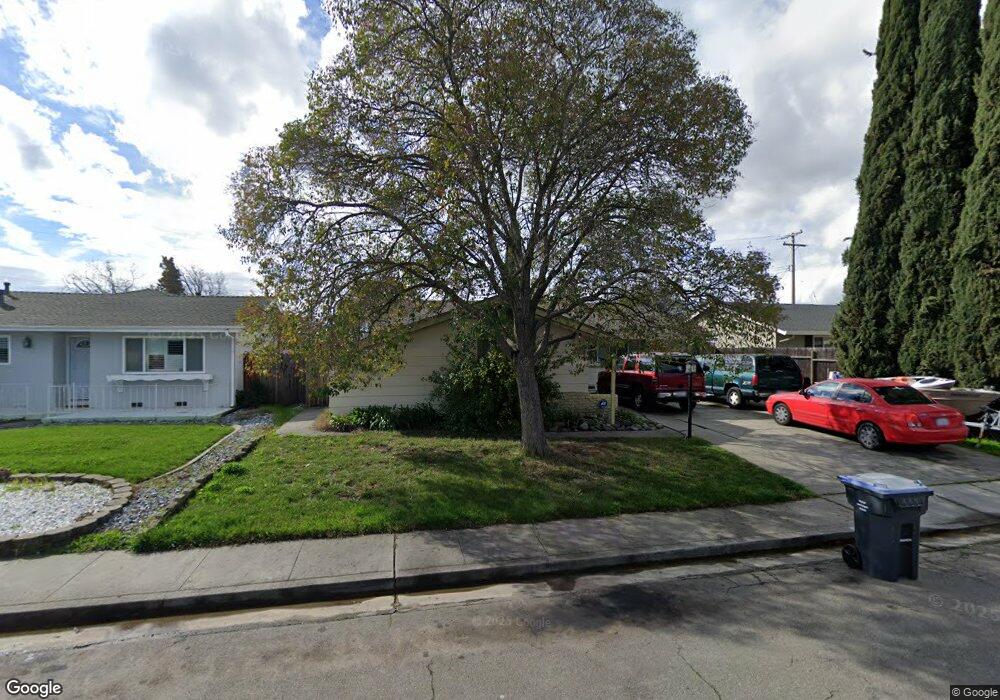
369 Lily St Fairfield, CA 94533
Estimated Value: $478,000 - $517,000
3
Beds
2
Baths
1,438
Sq Ft
$348/Sq Ft
Est. Value
About This Home
This home is located at 369 Lily St, Fairfield, CA 94533 and is currently estimated at $500,496, approximately $348 per square foot. 369 Lily St is a home located in Solano County with nearby schools including Dover Elementary School, Grange Middle School, and Fairfield High School.
Ownership History
Date
Name
Owned For
Owner Type
Purchase Details
Closed on
Feb 23, 2002
Sold by
Parkham August T and Parkham Annette K
Bought by
Nichols Stanton and Nichols Kathleen R
Current Estimated Value
Home Financials for this Owner
Home Financials are based on the most recent Mortgage that was taken out on this home.
Original Mortgage
$212,005
Outstanding Balance
$86,049
Interest Rate
6.8%
Mortgage Type
FHA
Estimated Equity
$414,447
Create a Home Valuation Report for This Property
The Home Valuation Report is an in-depth analysis detailing your home's value as well as a comparison with similar homes in the area
Home Values in the Area
Average Home Value in this Area
Purchase History
| Date | Buyer | Sale Price | Title Company |
|---|---|---|---|
| Nichols Stanton | $215,000 | Frontier Title Company |
Source: Public Records
Mortgage History
| Date | Status | Borrower | Loan Amount |
|---|---|---|---|
| Open | Nichols Stanton | $212,005 |
Source: Public Records
Tax History
| Year | Tax Paid | Tax Assessment Tax Assessment Total Assessment is a certain percentage of the fair market value that is determined by local assessors to be the total taxable value of land and additions on the property. | Land | Improvement |
|---|---|---|---|---|
| 2025 | $3,479 | $317,609 | $81,246 | $236,363 |
| 2024 | $3,479 | $311,382 | $79,653 | $231,729 |
| 2023 | $3,371 | $305,278 | $78,092 | $227,186 |
| 2022 | $3,329 | $299,293 | $76,561 | $222,732 |
| 2021 | $3,294 | $293,425 | $75,060 | $218,365 |
| 2020 | $3,217 | $290,417 | $74,291 | $216,126 |
| 2019 | $3,136 | $284,724 | $72,835 | $211,889 |
| 2018 | $3,236 | $279,142 | $71,407 | $207,735 |
| 2017 | $3,085 | $273,669 | $70,007 | $203,662 |
| 2016 | $3,058 | $268,304 | $68,635 | $199,669 |
| 2015 | $2,853 | $264,275 | $67,605 | $196,670 |
| 2014 | $2,224 | $205,000 | $49,000 | $156,000 |
Source: Public Records
Map
Nearby Homes
Your Personal Tour Guide
Ask me questions while you tour the home.