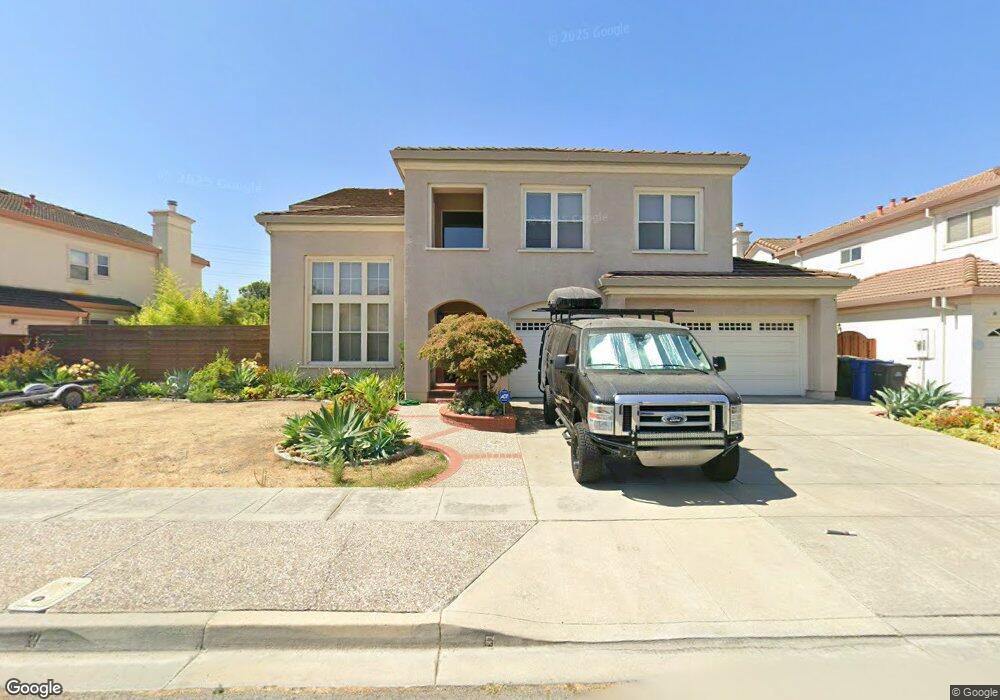
369 Paseo Refugio Milpitas, CA 95035
Estimated Value: $2,451,000 - $2,837,000
4
Beds
3
Baths
3,274
Sq Ft
$814/Sq Ft
Est. Value
About This Home
This home is located at 369 Paseo Refugio, Milpitas, CA 95035 and is currently estimated at $2,666,294, approximately $814 per square foot. 369 Paseo Refugio is a home located in Santa Clara County with nearby schools including Curtner Elementary School, Thomas Russell Middle School, and Milpitas High School.
Ownership History
Date
Name
Owned For
Owner Type
Purchase Details
Closed on
Dec 20, 2011
Sold by
Palmer Howard E
Bought by
Cho Sunghoon and Cho Primrose
Current Estimated Value
Home Financials for this Owner
Home Financials are based on the most recent Mortgage that was taken out on this home.
Original Mortgage
$756,000
Outstanding Balance
$515,414
Interest Rate
3.94%
Mortgage Type
New Conventional
Estimated Equity
$2,150,880
Purchase Details
Closed on
Jul 3, 2007
Sold by
Palmer Howard E and Palmer Juanita M
Bought by
Palmer Howard E and Palmer Juanita M
Purchase Details
Closed on
Nov 30, 1995
Sold by
Shapell Industries Inc
Bought by
Palmer Howard E and Palmer Marie
Purchase Details
Closed on
Nov 20, 1995
Sold by
Shapell Industries Inc
Bought by
Palmer Howard E and Palmer Marie
Create a Home Valuation Report for This Property
The Home Valuation Report is an in-depth analysis detailing your home's value as well as a comparison with similar homes in the area
Home Values in the Area
Average Home Value in this Area
Purchase History
| Date | Buyer | Sale Price | Title Company |
|---|---|---|---|
| Cho Sunghoon | $944,000 | North American Title Company | |
| Palmer Howard E | -- | None Available | |
| Palmer Howard E | -- | First American Title Guarant | |
| Palmer Howard E | $467,000 | First American Title Guarant |
Source: Public Records
Mortgage History
| Date | Status | Borrower | Loan Amount |
|---|---|---|---|
| Open | Cho Sunghoon | $756,000 |
Source: Public Records
Tax History
| Year | Tax Paid | Tax Assessment Tax Assessment Total Assessment is a certain percentage of the fair market value that is determined by local assessors to be the total taxable value of land and additions on the property. | Land | Improvement |
|---|---|---|---|---|
| 2025 | $13,474 | $1,185,706 | $592,853 | $592,853 |
| 2024 | $13,474 | $1,162,458 | $581,229 | $581,229 |
| 2023 | $13,431 | $1,139,666 | $569,833 | $569,833 |
| 2022 | $13,374 | $1,117,320 | $558,660 | $558,660 |
| 2021 | $13,179 | $1,095,412 | $547,706 | $547,706 |
| 2020 | $12,948 | $1,084,180 | $542,090 | $542,090 |
| 2019 | $12,798 | $1,062,922 | $531,461 | $531,461 |
| 2018 | $12,148 | $1,042,082 | $521,041 | $521,041 |
| 2017 | $11,990 | $1,021,650 | $510,825 | $510,825 |
| 2016 | $11,507 | $1,001,618 | $500,809 | $500,809 |
| 2015 | $11,389 | $986,574 | $493,287 | $493,287 |
| 2014 | $11,092 | $967,250 | $483,625 | $483,625 |
Source: Public Records
Map
Nearby Homes
- 7280 Marylinn Dr
- 102 Marylinn Dr
- 0 Railroad Ave
- 170 Marylinn Dr
- 685 Parvin Dr
- 60 Jacklin Place
- 207 Redwood Ave
- 137 Caladenia Ln
- 1000 Jacklin Rd
- 1006 N Abbott Ave
- 1008 N Abbott Ave
- 808 Cameron Cir
- 50 Serra Way
- 513 Glenmoor Cir
- 527 Maple Ave
- 1200 N Abbott Ave Unit 200
- 472 Glenmoor Cir
- 551 Chestnut Ave
- 1087 N Abbott Ave
- 1103 Creed St
- 377 Paseo Refugio
- 361 Paseo Refugio
- 385 Paseo Refugio
- 457 Paseo Refugio
- 465 Paseo Refugio
- 470 Dundee Ave
- 473 Paseo Refugio
- 457 Dundee Ave
- 446 Folsom Ct
- 452 Folsom Ct Unit 2
- 458 Folsom Ct
- 481 Paseo Refugio
- 463 Dundee Ave
- 464 Folsom Cir
- 466 Loch Lomond Ct
- 456 Loch Lomond Ct
- 470 Folsom Cir
- 446 Loch Lomond Ct
- 476 Loch Lomond Ct
- 476 Folsom Cir
Your Personal Tour Guide
Ask me questions while you tour the home.