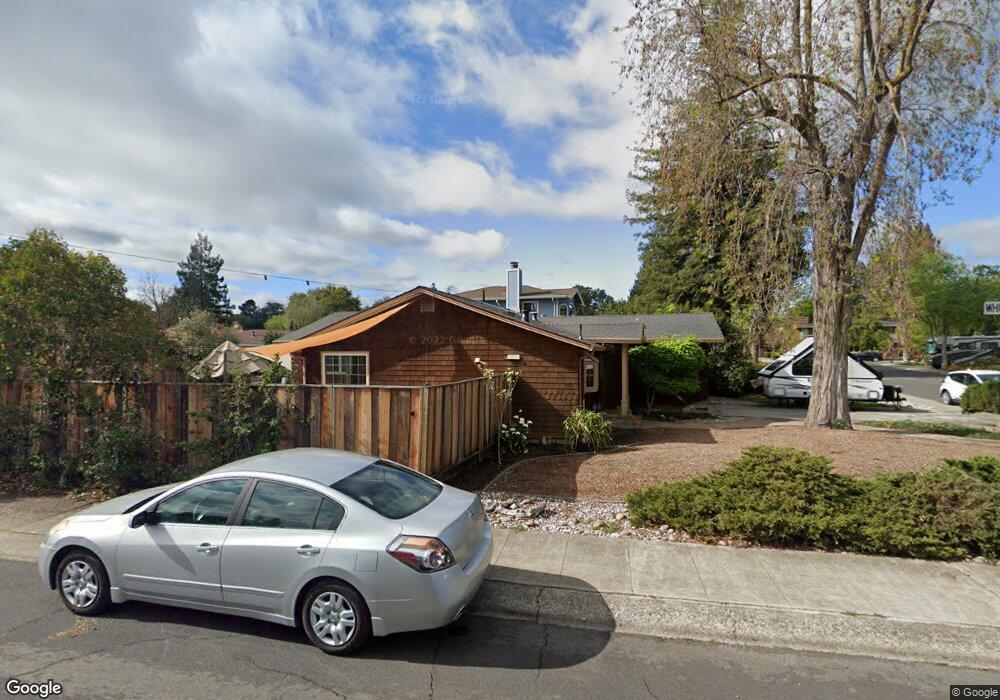
369 Whitclem Dr Palo Alto, CA 94306
Charleston Meadows NeighborhoodEstimated Value: $2,290,000 - $2,782,000
3
Beds
1
Bath
1,168
Sq Ft
$2,223/Sq Ft
Est. Value
About This Home
This home is located at 369 Whitclem Dr, Palo Alto, CA 94306 and is currently estimated at $2,595,887, approximately $2,222 per square foot. 369 Whitclem Dr is a home located in Santa Clara County with nearby schools including Juana Briones Elementary School, Ellen Fletcher Middle, and Henry M. Gunn High School.
Ownership History
Date
Name
Owned For
Owner Type
Purchase Details
Closed on
Jun 24, 2024
Sold by
Jennings Joan Marie
Bought by
Jennings Family Trust and Jennings
Current Estimated Value
Create a Home Valuation Report for This Property
The Home Valuation Report is an in-depth analysis detailing your home's value as well as a comparison with similar homes in the area
Home Values in the Area
Average Home Value in this Area
Purchase History
| Date | Buyer | Sale Price | Title Company |
|---|---|---|---|
| Jennings Family Trust | -- | None Listed On Document |
Source: Public Records
Tax History Compared to Growth
Tax History
| Year | Tax Paid | Tax Assessment Tax Assessment Total Assessment is a certain percentage of the fair market value that is determined by local assessors to be the total taxable value of land and additions on the property. | Land | Improvement |
|---|---|---|---|---|
| 2025 | $4,294 | $291,621 | $152,377 | $139,244 |
| 2024 | $4,294 | $285,904 | $149,390 | $136,514 |
| 2023 | $4,225 | $280,299 | $146,461 | $133,838 |
| 2022 | $4,166 | $274,804 | $143,590 | $131,214 |
| 2021 | $4,082 | $269,417 | $140,775 | $128,642 |
| 2020 | $4,013 | $266,655 | $139,332 | $127,323 |
| 2019 | $3,962 | $261,427 | $136,600 | $124,827 |
| 2018 | $3,871 | $256,302 | $133,922 | $122,380 |
| 2017 | $3,800 | $251,278 | $131,297 | $119,981 |
| 2016 | $3,694 | $246,352 | $128,723 | $117,629 |
| 2015 | $3,650 | $242,653 | $126,790 | $115,863 |
| 2014 | $3,484 | $237,901 | $124,307 | $113,594 |
Source: Public Records
Map
Nearby Homes
- 278 Monroe Dr Unit 35
- 4206 Rickeys Way Unit C
- 4225 Park Blvd
- 342 Carolina Ln
- 4173 El Camino Real Unit 1
- 4250 El Camino Real Unit B120
- 181 Del Medio Ave Unit 307
- 579 Glenbrook Dr
- 4132 Thain Way
- 26 Roosevelt Cir
- 3941 Duncan Place
- 4287 Pomona Ave
- 2255 Showers Dr Unit 152
- 4198 Cherry Oaks Place
- 645 Maybell Ave Unit A
- 418 Ferne Ave
- 717 Los Robles Ave
- 3428 Alma Village Cir
- 3888 Magnolia Dr
- 444 San Antonio Rd Unit 1A
- 371 Whitclem Dr
- 353 Whitclem Place
- 383 Whitclem Dr
- 367 Whitclem Place
- 343 Whitclem Dr
- 374 Whitclem Dr
- 384 Whitclem Dr
- 354 Whitclem Dr
- 363 Whitclem Place
- 4279 Wilkie Way
- 393 Whitclem Dr
- 361 Whitclem Place
- 386 Whitclem Dr
- 357 Whitclem Place
- 344 Whitclem Dr
- 321 Whitclem Dr
- 4283 Wilkie Way
- 398 Whitclem Dr
- 324 Whitclem Dr
- 4287 Wilkie Way