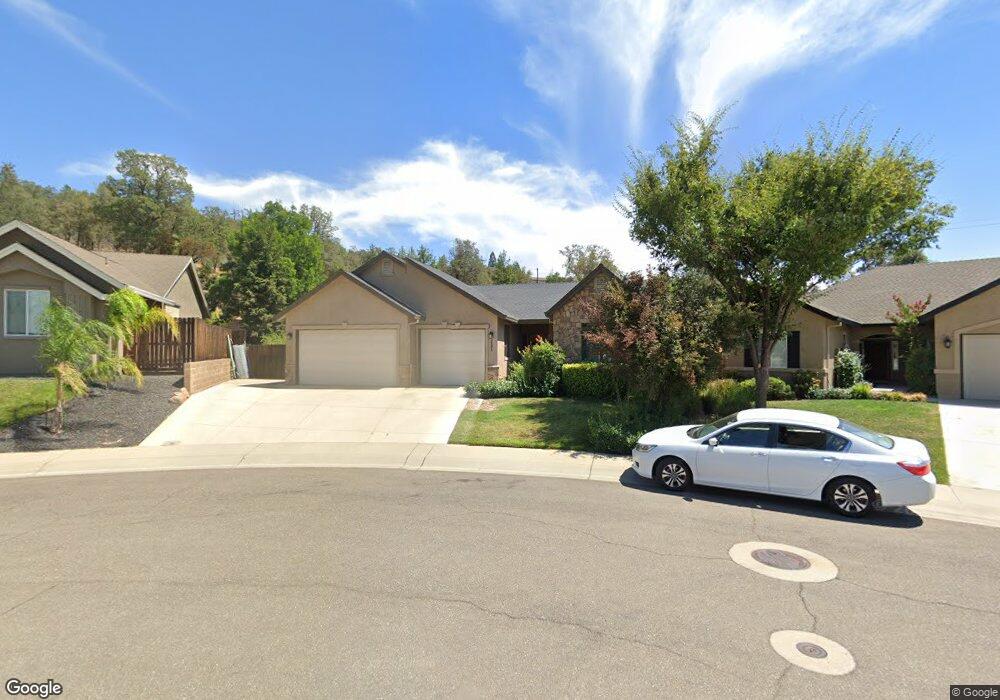
3691 Foothill Blvd Unit Lot 9 Redding, CA 96001
Manzanita NeighborhoodEstimated Value: $444,751 - $569,000
3
Beds
2
Baths
1,748
Sq Ft
$285/Sq Ft
Est. Value
About This Home
This home is located at 3691 Foothill Blvd Unit Lot 9, Redding, CA 96001 and is currently estimated at $498,938, approximately $285 per square foot. 3691 Foothill Blvd Unit Lot 9 is a home located in Shasta County with nearby schools including Manzanita Elementary School, Sequoia Middle School, and Shasta High School.
Ownership History
Date
Name
Owned For
Owner Type
Purchase Details
Closed on
Apr 4, 2015
Sold by
Morris Jeffry and Morris Rosalind
Bought by
Parker Family 1995 Trust and Parker Kathy J
Current Estimated Value
Purchase Details
Closed on
Apr 15, 2009
Sold by
S&J Development Inc
Bought by
Morris Jeffry and Morris Rosalind
Purchase Details
Closed on
Jun 26, 2008
Sold by
North Valley Bank
Bought by
S&J Development Inc
Home Financials for this Owner
Home Financials are based on the most recent Mortgage that was taken out on this home.
Original Mortgage
$1,600,000
Interest Rate
5.99%
Mortgage Type
Seller Take Back
Purchase Details
Closed on
Jun 24, 2008
Sold by
Premier Homes Properties Inc
Bought by
North Valley Bank
Home Financials for this Owner
Home Financials are based on the most recent Mortgage that was taken out on this home.
Original Mortgage
$1,600,000
Interest Rate
5.99%
Mortgage Type
Seller Take Back
Create a Home Valuation Report for This Property
The Home Valuation Report is an in-depth analysis detailing your home's value as well as a comparison with similar homes in the area
Home Values in the Area
Average Home Value in this Area
Purchase History
| Date | Buyer | Sale Price | Title Company |
|---|---|---|---|
| Parker Family 1995 Trust | $325,000 | Fidelity National Title Co | |
| Morris Jeffry | $317,000 | Placer Title Company | |
| S&J Development Inc | $1,375,500 | Placer Title Company | |
| North Valley Bank | -- | Placer Title Company |
Source: Public Records
Mortgage History
| Date | Status | Borrower | Loan Amount |
|---|---|---|---|
| Previous Owner | S&J Development Inc | $1,600,000 |
Source: Public Records
Tax History
| Year | Tax Paid | Tax Assessment Tax Assessment Total Assessment is a certain percentage of the fair market value that is determined by local assessors to be the total taxable value of land and additions on the property. | Land | Improvement |
|---|---|---|---|---|
| 2025 | $4,402 | $390,592 | $96,143 | $294,449 |
| 2024 | $4,324 | $382,934 | $94,258 | $288,676 |
| 2023 | $4,324 | $375,426 | $92,410 | $283,016 |
| 2022 | $4,246 | $368,066 | $90,599 | $277,467 |
| 2021 | $4,219 | $360,850 | $88,823 | $272,027 |
| 2020 | $4,249 | $357,151 | $87,913 | $269,238 |
| 2019 | $4,034 | $350,149 | $86,190 | $263,959 |
| 2018 | $4,069 | $343,284 | $84,500 | $258,784 |
| 2017 | $3,856 | $336,554 | $82,844 | $253,710 |
| 2016 | $3,908 | $329,956 | $81,220 | $248,736 |
| 2015 | $3,462 | $314,000 | $80,000 | $234,000 |
| 2014 | $3,437 | $290,000 | $70,000 | $220,000 |
Source: Public Records
Map
Nearby Homes
- 3701 Cal Ore Dr
- 3582 Stone Ridge Place
- 1426 Gladstone Ct
- 3821 Pebble Dr
- 3345 Oakwood Place
- 1355 Bambury Ct
- 1430 Ridge Dr
- 3510 Eureka Way
- 3320 Stratford Ave
- 3380 Placer St
- 1163 Sunriver Ln
- 3882 Fujiyama Way
- 1525 Oak St
- 938 Leisha Ln
- 3126 Riesling Path
- 4160 Travona Ct
- 1692 Kildare Dr
- 1695 Kildare Dr
- 1025 Chardonnay Walk
- 3330 Scenic Dr
- 3691 Foothill Blvd
- 3671 Foothill Blvd
- 1490 Jen Way Unit Lot 10
- 1490 Jen Way
- 3651 Foothill Blvd Unit Lot 7
- 3651 Foothill Blvd
- 1478 Jen Way Unit Lot 11
- 1478 Jen Way
- 3698 Foothill Blvd Unit Lot 31
- 3698 Foothill Blvd
- 3631 Foothill Blvd Unit Lot 6
- 3631 Foothill Blvd
- 3848 Cal Ore Dr
- 3832 Cal Ore Dr
- 1466 Jen Way Unit Lot 12
- 1466 Jen Way
- 3668 Foothill Blvd
- 3864 Cal Ore Dr
- 3816 Cal Ore Dr
- 3876 Cal Ore Dr
Your Personal Tour Guide
Ask me questions while you tour the home.