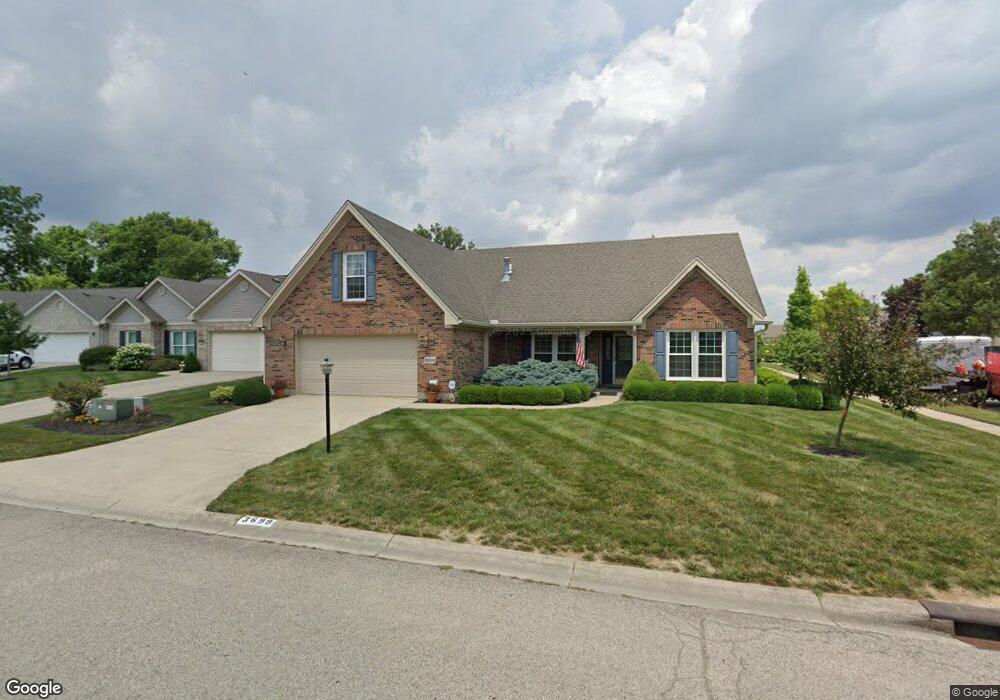
3699 Madison Square Place Dayton, OH 45414
Estimated Value: $302,000 - $326,000
3
Beds
2
Baths
1,968
Sq Ft
$159/Sq Ft
Est. Value
About This Home
This home is located at 3699 Madison Square Place, Dayton, OH 45414 and is currently estimated at $313,263, approximately $159 per square foot. 3699 Madison Square Place is a home located in Montgomery County with nearby schools including Demmitt Elementary School, Smith Middle School, and Butler High School.
Ownership History
Date
Name
Owned For
Owner Type
Purchase Details
Closed on
Aug 5, 2025
Sold by
Neiswender Willa M
Bought by
Neiswender Willa M and Newland Deidre M
Current Estimated Value
Purchase Details
Closed on
Mar 15, 2010
Sold by
Neiswender George W and Neiswender Willa M
Bought by
Neiswender George W and Neiswender Willa M
Purchase Details
Closed on
Aug 4, 2004
Sold by
Johnston Carroll E and Johnston Patricia A
Bought by
Neiswender George W and Neiswender Willa M
Home Financials for this Owner
Home Financials are based on the most recent Mortgage that was taken out on this home.
Original Mortgage
$72,300
Interest Rate
6.34%
Mortgage Type
Fannie Mae Freddie Mac
Purchase Details
Closed on
Aug 21, 2001
Sold by
Rengers/Peebles Llc
Bought by
Johnston Carroll E and Johnston Patricia A
Home Financials for this Owner
Home Financials are based on the most recent Mortgage that was taken out on this home.
Original Mortgage
$157,000
Interest Rate
7.28%
Create a Home Valuation Report for This Property
The Home Valuation Report is an in-depth analysis detailing your home's value as well as a comparison with similar homes in the area
Home Values in the Area
Average Home Value in this Area
Purchase History
| Date | Buyer | Sale Price | Title Company |
|---|---|---|---|
| Neiswender Willa M | -- | None Listed On Document | |
| Neiswender George W | -- | None Available | |
| Neiswender George W | $220,000 | -- | |
| Johnston Carroll E | $37,500 | Equity Land Title Agency Inc |
Source: Public Records
Mortgage History
| Date | Status | Borrower | Loan Amount |
|---|---|---|---|
| Previous Owner | Neiswender George W | $72,300 | |
| Previous Owner | Johnston Carroll E | $157,000 |
Source: Public Records
Tax History Compared to Growth
Tax History
| Year | Tax Paid | Tax Assessment Tax Assessment Total Assessment is a certain percentage of the fair market value that is determined by local assessors to be the total taxable value of land and additions on the property. | Land | Improvement |
|---|---|---|---|---|
| 2024 | $4,558 | $83,170 | $16,170 | $67,000 |
| 2023 | $4,558 | $83,170 | $16,170 | $67,000 |
| 2022 | $4,195 | $63,010 | $12,250 | $50,760 |
| 2021 | $4,196 | $63,010 | $12,250 | $50,760 |
| 2020 | $4,185 | $63,010 | $12,250 | $50,760 |
| 2019 | $4,530 | $62,340 | $12,250 | $50,090 |
| 2018 | $4,538 | $62,340 | $12,250 | $50,090 |
| 2017 | $4,508 | $62,340 | $12,250 | $50,090 |
| 2016 | $4,122 | $56,800 | $12,250 | $44,550 |
| 2015 | $3,908 | $56,800 | $12,250 | $44,550 |
| 2014 | $3,908 | $56,800 | $12,250 | $44,550 |
| 2012 | -- | $53,450 | $12,250 | $41,200 |
Source: Public Records
Map
Nearby Homes
- 7420 New York Way
- 3600 Little York Rd
- 7227 Gardenside Dr
- 3518 Park Crest Ln
- 7475 Brantford Rd
- 7184 Brantford Rd
- 7612 Turtleback Dr
- 3166 Little York Rd
- 7019 Brantford Rd
- Johnstown Plan at Yorkshire Reserve - The Oaks at Yorkshire Reserve
- Newcastle Plan at Yorkshire Reserve - The Oaks at Yorkshire Reserve
- Bellamy Plan at Yorkshire Reserve - The Oaks at Yorkshire Reserve
- Milford Plan at Yorkshire Reserve - The Oaks at Yorkshire Reserve
- Holcombe Plan at Yorkshire Reserve - The Oaks at Yorkshire Reserve
- Chatham Plan at Yorkshire Reserve - The Oaks at Yorkshire Reserve
- 1631 Ashley Place
- 678 Deerhurst Dr
- 7562 Yorkshire Dr
- 710 Deerhurst Dr
- 7568 Yorkshire Dr
- 3695 Madison Square Place
- 3612 English Ct
- 3608 English Ct
- 7444 New York Way
- 7448 New York Way
- 3691 Madison Square Place
- 7440 New York Way
- 3700 Madison Square Place
- 7452 New York Way
- 3604 English Ct
- 3696 Madison Square Place
- 3687 Madison Square Place
- 7436 New York Way
- 7456 New York Way
- 3692 Madison Square Place
- 3688 Madison Square Place
- 3600 English Ct
- 7432 New York Way
- 7460 New York Way
- 7331 Mcsmith Ln