36W710 Oak Rd Unit 3 Saint Charles, IL 60175
Farmington-Fox River Valley NeighborhoodEstimated Value: $577,813 - $653,000
4
Beds
3
Baths
2,626
Sq Ft
$239/Sq Ft
Est. Value
About This Home
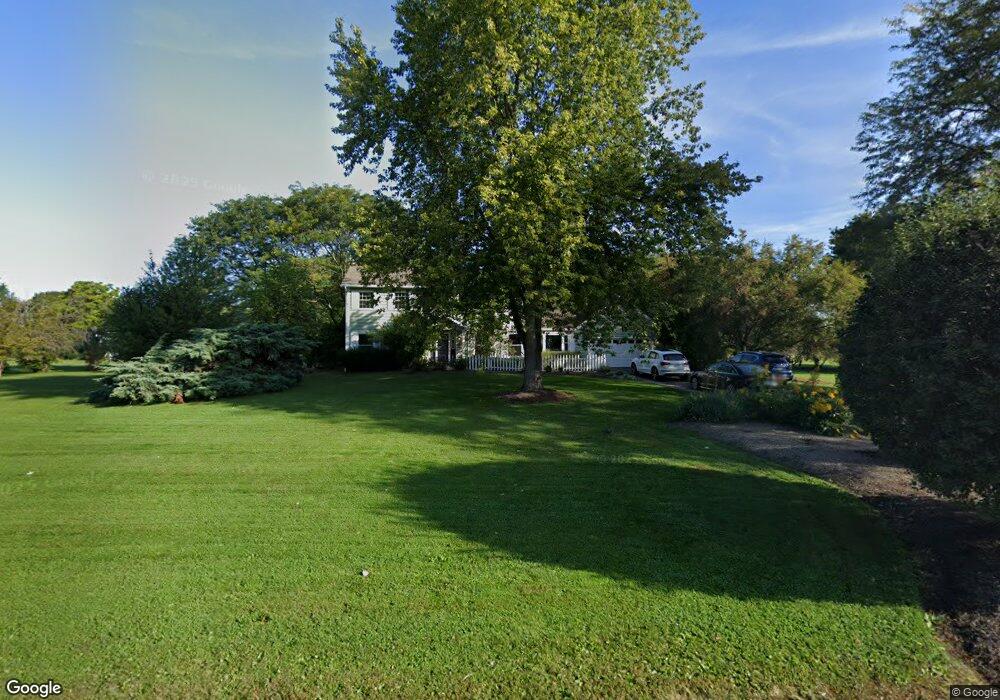
This home is located at 36W710 Oak Rd Unit 3, Saint Charles, IL 60175 and is currently estimated at $626,453, approximately $238 per square foot. 36W710 Oak Rd Unit 3 is a home located in Kane County with nearby schools including Wild Rose Elementary School, Wredling Middle School, and St Charles North High School.
Ownership History
Date
Name
Owned For
Owner Type
Purchase Details
Closed on
Jan 29, 2025
Sold by
Piggott Richard P and Piggott Deirdre A
Bought by
Piggott Richard P and Livi Deirdre
Current Estimated Value
Purchase Details
Closed on
Jan 21, 2015
Sold by
Piggott Richard P and Piggott Elaine C
Bought by
Piggott Richard P and Piggott Deirdre A
Home Financials for this Owner
Home Financials are based on the most recent Mortgage that was taken out on this home.
Original Mortgage
$248,000
Interest Rate
3.37%
Mortgage Type
New Conventional
Purchase Details
Closed on
Feb 26, 1998
Sold by
Strickland Robert G and Strickland Dena W
Bought by
Piggott Richard P and Piggott Elaine C
Home Financials for this Owner
Home Financials are based on the most recent Mortgage that was taken out on this home.
Original Mortgage
$160,000
Interest Rate
6.95%
Create a Home Valuation Report for This Property
The Home Valuation Report is an in-depth analysis detailing your home's value as well as a comparison with similar homes in the area
Home Values in the Area
Average Home Value in this Area
Purchase History
| Date | Buyer | Sale Price | Title Company |
|---|---|---|---|
| Piggott Richard P | -- | None Listed On Document | |
| Piggott Richard P | -- | Unisource | |
| Piggott Richard P | $285,000 | Advanced Title Services Inc |
Source: Public Records
Mortgage History
| Date | Status | Borrower | Loan Amount |
|---|---|---|---|
| Previous Owner | Piggott Richard P | $248,000 | |
| Previous Owner | Piggott Richard P | $160,000 |
Source: Public Records
Tax History Compared to Growth
Tax History
| Year | Tax Paid | Tax Assessment Tax Assessment Total Assessment is a certain percentage of the fair market value that is determined by local assessors to be the total taxable value of land and additions on the property. | Land | Improvement |
|---|---|---|---|---|
| 2024 | $9,922 | $148,148 | $46,550 | $101,598 |
| 2023 | $9,443 | $132,595 | $41,663 | $90,932 |
| 2022 | $9,487 | $130,032 | $45,192 | $84,840 |
| 2021 | $8,943 | $123,946 | $43,077 | $80,869 |
| 2020 | $8,881 | $121,635 | $42,274 | $79,361 |
| 2019 | $8,720 | $119,227 | $41,437 | $77,790 |
| 2018 | $8,501 | $116,142 | $40,676 | $75,466 |
| 2017 | $8,281 | $112,171 | $39,285 | $72,886 |
| 2016 | $8,713 | $108,231 | $37,905 | $70,326 |
| 2015 | -- | $97,058 | $37,496 | $59,562 |
| 2014 | -- | $95,469 | $37,496 | $57,973 |
| 2013 | -- | $102,751 | $37,871 | $64,880 |
Source: Public Records
Map
Nearby Homes
- 5N400 Fence Rail Ct
- 4N922 Dover Hill Rd
- 5N070 State Route 31
- 5N661 Leola Ln
- 4N680 Ware Woods Dr
- 4N675 Old Farm Rd
- 37W004 Ridgewood Dr
- 5N024 Il Route 31
- 135 Thornhill Farm Ln Unit 1
- 36W824 Red Gate Ct
- 106 Sumac Ct
- 5N092 Grove Ave
- 5N113 Burr Rd
- 43W321 Creekside Ct
- 5N107 Burr Rd
- 6N362 Riverside Dr
- 6N323 Riverside Dr
- 3N866 Ferson Creek Rd
- 1987 Sagebrook Dr
- 36W172 Silver Glen Ct
- 5N390 Oak Rd
- 36W758 Oak Rd Unit 3
- 36W687 Oak Rd
- 5N315 Deerpath Way
- 36W665 Oak Rd
- 5N351 Oak Rd
- 5N430 Oak Rd
- 36W755 Oak Rd
- 5N365 Oak Rd
- 36W780 Oak Rd
- 5N275 Deerpath Way
- 5N302 Deerpath Way Unit 3
- 5N381 Oak Rd
- 5N411 Oak Rd
- 36W799 Oak Rd Unit 3
- 5N255 Deerpath Way
- 5N280 Deerpath Way
- 5N419 Oak Rd
- 5N443 Oak Rd
- 3417 Dover Hill Ct