Estimated Value: $176,668 - $381,000
2
Beds
1
Bath
776
Sq Ft
$306/Sq Ft
Est. Value
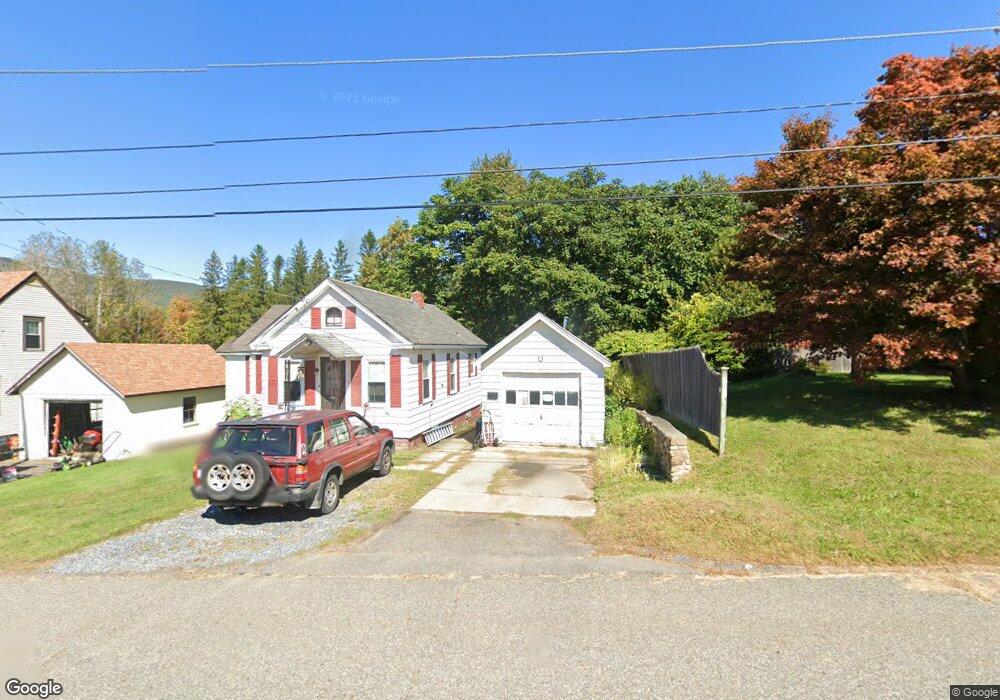
About This Home
This home is located at 37 Anthony St, Adams, MA 01220 and is currently estimated at $237,667, approximately $306 per square foot. 37 Anthony St is a home located in Berkshire County with nearby schools including Hoosac Valley Middle & High School, Berkshire Arts & Technology Charter Public School, and St. Stanislaus Kostka School.
Ownership History
Date
Name
Owned For
Owner Type
Purchase Details
Closed on
Jun 27, 1997
Sold by
Solari Christopher J and Solari Cheryl L
Bought by
Sabia Terri A
Current Estimated Value
Purchase Details
Closed on
Feb 1, 1994
Sold by
Blazejewski Velma M
Bought by
Solari Christopher J
Home Financials for this Owner
Home Financials are based on the most recent Mortgage that was taken out on this home.
Original Mortgage
$60,610
Interest Rate
7.11%
Mortgage Type
Purchase Money Mortgage
Create a Home Valuation Report for This Property
The Home Valuation Report is an in-depth analysis detailing your home's value as well as a comparison with similar homes in the area
Home Values in the Area
Average Home Value in this Area
Purchase History
| Date | Buyer | Sale Price | Title Company |
|---|---|---|---|
| Sabia Terri A | $88,000 | -- | |
| Solari Christopher J | $65,000 | -- |
Source: Public Records
Mortgage History
| Date | Status | Borrower | Loan Amount |
|---|---|---|---|
| Open | Solari Christopher J | $42,000 | |
| Closed | Solari Christopher J | $30,000 | |
| Closed | Solari Christopher J | $4,000 | |
| Previous Owner | Solari Christopher J | $60,610 |
Source: Public Records
Tax History
| Year | Tax Paid | Tax Assessment Tax Assessment Total Assessment is a certain percentage of the fair market value that is determined by local assessors to be the total taxable value of land and additions on the property. | Land | Improvement |
|---|---|---|---|---|
| 2025 | $2,601 | $152,900 | $44,700 | $108,200 |
| 2024 | $2,461 | $140,300 | $42,000 | $98,300 |
| 2023 | $2,300 | $124,000 | $38,200 | $85,800 |
| 2022 | $2,254 | $107,900 | $33,200 | $74,700 |
| 2021 | $2,436 | $98,500 | $33,200 | $65,300 |
| 2020 | $2,107 | $96,300 | $33,200 | $63,100 |
| 2019 | $3,086 | $96,300 | $33,200 | $63,100 |
| 2018 | $3,066 | $95,100 | $33,200 | $61,900 |
| 2017 | $368 | $95,100 | $33,200 | $61,900 |
| 2016 | $1,884 | $88,100 | $33,200 | $54,900 |
| 2015 | $1,857 | $86,900 | $34,700 | $52,200 |
| 2014 | $1,734 | $86,900 | $34,700 | $52,200 |
Source: Public Records
Map
Nearby Homes
Your Personal Tour Guide
Ask me questions while you tour the home.