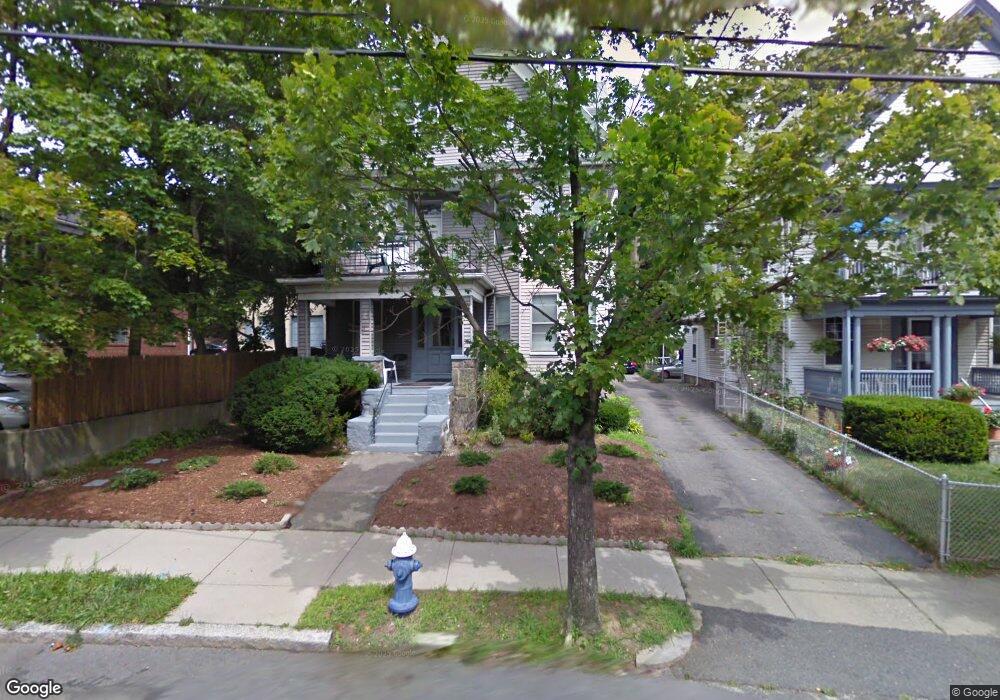
37 Bartlett Crescent Brookline, MA 02446
Washington Square NeighborhoodEstimated Value: $2,469,000 - $2,925,672
About This Home
Recently renovated, spacious 2 bedroom, 1.5 bath first floor apartment in a two-family. Conveniently located on a quiet, residential street, this spacious apartment features high ceilings, oversized windows, recently refinished hardwood floors, full size laundry in unit, bay windows, great sunlight and front porch. This 7 room apartment includes a large living room and formal dining room. The beautifully renovated large eat in kitchen features white cabinets and is fully equipped with stainless steel appliances, dishwasher, quartz counters and tile floor. Located in the convenient Washington Square area between Coolidge Corner and Cleveland Circle, a block away from Whole Foods, 5-minute walk to the C and B MBTA Green Lines, and on the 65 Bus route to the Longwood Medical Area (12 minute ride). Close to trendy Washington Square restaurants and pubs. 1 Parking space is included in rent! An additional parking space is available for rent. 73260 506
Ownership History
Purchase Details
Home Values in the Area
Average Home Value in this Area
Purchase History
| Date | Buyer | Sale Price | Title Company |
|---|---|---|---|
| 37 Bartlett Crescent R | -- | -- |
Property History
| Date | Event | Price | List to Sale | Price per Sq Ft |
|---|---|---|---|---|
| 10/08/2024 10/08/24 | Off Market | $4,000 | -- | -- |
| 08/31/2024 08/31/24 | For Rent | $4,000 | -- | -- |
Tax History
| Year | Tax Paid | Tax Assessment Tax Assessment Total Assessment is a certain percentage of the fair market value that is determined by local assessors to be the total taxable value of land and additions on the property. | Land | Improvement |
|---|---|---|---|---|
| 2025 | $25,941 | $2,628,300 | $1,343,400 | $1,284,900 |
| 2024 | $25,505 | $2,610,500 | $1,291,200 | $1,319,300 |
| 2023 | $24,593 | $2,466,700 | $1,122,800 | $1,343,900 |
| 2022 | $23,938 | $2,349,200 | $1,069,300 | $1,279,900 |
| 2021 | $22,137 | $2,258,900 | $1,028,200 | $1,230,700 |
| 2020 | $20,487 | $2,167,900 | $894,100 | $1,273,800 |
| 2019 | $19,345 | $2,064,600 | $851,500 | $1,213,100 |
| 2018 | $15,215 | $1,608,300 | $710,700 | $897,600 |
| 2017 | $14,714 | $1,489,300 | $670,600 | $818,700 |
| 2016 | $14,108 | $1,353,900 | $626,700 | $727,200 |
| 2015 | $12,102 | $1,133,100 | $488,000 | $645,100 |
| 2014 | $11,620 | $1,020,200 | $443,700 | $576,500 |
Map
- 45 Bartlett Crescent Unit 402
- 45 Bartlett Crescent Unit 404
- 45 Bartlett Crescent Unit 302
- 45 Bartlett Crescent Unit 401
- 45 Bartlett Crescent Unit 101
- 45 Bartlett Crescent Unit 203
- 45 Bartlett Crescent Unit 206
- 45 Bartlett Crescent Unit 105
- 9 Downing Rd
- 133 Westbourne Terrace Unit 2
- 311 Allston St Unit 11
- 309 Allston St Unit 6
- 300 Allston St Unit 401
- 300 Allston St Unit 205
- 114 Evans Rd Unit 5
- 230 Corey Rd
- 227 Summit Ave Unit E405
- 33 Westbourne Terrace Unit 4
- 249 Corey Rd Unit 404
- 249 Corey Rd Unit 306
- 37 Bartlett Crescent
- 37 Bartlett Crescent Unit 37
- 37 Bartlett Crescent Unit 1
- 33 Bartlett Crescent
- 33 Bartlett Crescent
- 33 Bartlett Crescent Unit 2
- 45 Bartlett Crescent
- 45 Bartlett Crescent Unit 305
- 45 Bartlett Crescent Unit 102
- 45 Bartlett Crescent Unit 202
- 45 Bartlett Crescent Unit 403
- 45 Bartlett Crescent Unit 201
- 29 Bartlett Crescent
- 29 Bartlett Crescent
- 29 Bartlett Crescent Unit 1
- 811 Washington St Unit 14
- 811 Washington St Unit A
- 811 Washington St
- 811 Washington St Unit 1
- 811 Washington St Unit 2
Ask me questions while you tour the home.