
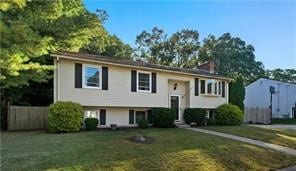
37 Carriage Rd Cranston, RI 02920
Western Cranston NeighborhoodEstimated payment $3,049/month
Highlights
- Very Popular Property
- Marina
- Media Room
- Cranston High School West Rated 9+
- Golf Course Community
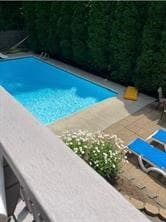
- In Ground Pool
About This Home
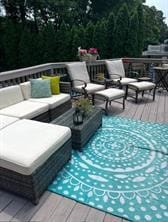
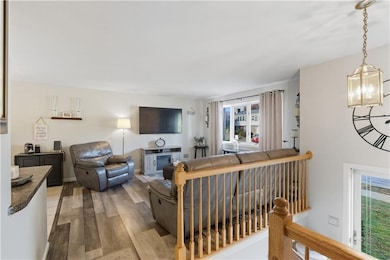
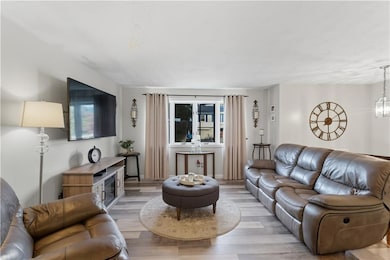
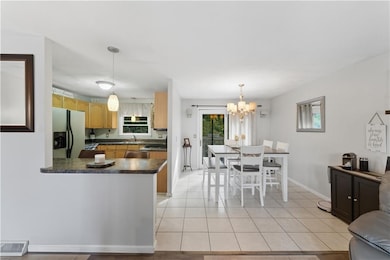
Welcome home! Nestled in highly sought-after Western Cranston, this exceptional 3 Bedroom, 2 Full bath raised ranch pool home offers the perfect blend of comfort, convenience, and style. Meticulously maintained, the home features open and airy living room/kitchen areas with abundant natural light, 3 comfortable sized bedrooms, and a full bath all found on the upper level. Walk downstairs to enjoy your beautifully finished lower level with a bedroom, another full bath, convenient washer and dryer, yet another finished storage room/office/flex space, a living room with cozy woodstove/fireplace and a super convenient full slider walkout. The property's outdoor amenities are equally impressive, including an oversized rear deck to enjoy your morning coffee, grilling or simply relaxing, overlooking your beautiful backyard oasis complete with a gorgeous private in-ground pool, perfect for relaxation and entertaining. Additional highlights include central air conditioning, gas heating, a spacious fenced in backyard offering ample room for recreation, and a full sized shed for additional storage. Conveniently located near Rt 295, Rt 95, great shopping, delicious dining, and much more.. this stunning home provides an ideal combination of indoor comfort and outdoor leisure in one of Western Cranston's most desirable areas. Don't miss this rare opportunity!
Listing Agent
HomeSmart Professionals Brokerage Phone: 401-921-5011 License #RES.0041653 Listed on: 10/31/2025

Home Details
Home Type
- Single Family
Est. Annual Taxes
- $5,237
Year Built
- Built in 1978
Lot Details
- 9,583 Sq Ft Lot
- Fenced
Home Design
- Raised Ranch Architecture
- Shingle Siding
- Vinyl Siding
- Concrete Perimeter Foundation
- Plaster
Interior Spaces
- 2-Story Property
- Wood Burning Stove
- Wood Burning Fireplace
- Self Contained Fireplace Unit Or Insert
- Fireplace Features Masonry
- Family Room
- Living Room
- Media Room
- Home Office
- Game Room
- Storage Room
- Utility Room
Kitchen
- Oven
- Range
- Microwave
- Dishwasher
Flooring
- Carpet
- Laminate
- Ceramic Tile
Bedrooms and Bathrooms
- 3 Bedrooms
- 2 Full Bathrooms
- Bathtub with Shower
Laundry
- Laundry Room
- Dryer
- Washer
Finished Basement
- Walk-Out Basement
- Basement Fills Entire Space Under The House
Parking
- 4 Parking Spaces
- No Garage
- Driveway
Utilities
- Window Unit Cooling System
- Forced Air Heating and Cooling System
- Heating System Uses Gas
- 100 Amp Service
- Water Heater
- Septic Tank
- Cable TV Available
Additional Features
- In Ground Pool
- Property near a hospital
Listing and Financial Details
- Tax Lot 1802
- Assessor Parcel Number 37CARRIAGERDCRAN
Community Details
Overview
- Western Cranston Subdivision
Amenities
- Shops
- Restaurant
- Public Transportation
Recreation
- Marina
- Golf Course Community
- Tennis Courts
- Recreation Facilities
Map
Home Values in the Area
Average Home Value in this Area
Tax History
| Year | Tax Paid | Tax Assessment Tax Assessment Total Assessment is a certain percentage of the fair market value that is determined by local assessors to be the total taxable value of land and additions on the property. | Land | Improvement |
|---|---|---|---|---|
| 2025 | $5,237 | $377,300 | $110,300 | $267,000 |
| 2024 | $5,135 | $377,300 | $110,300 | $267,000 |
| 2023 | $5,063 | $267,900 | $76,100 | $191,800 |
| 2022 | $4,959 | $267,900 | $76,100 | $191,800 |
| 2021 | $4,822 | $267,900 | $76,100 | $191,800 |
| 2020 | $4,854 | $233,700 | $79,800 | $153,900 |
| 2019 | $4,854 | $233,700 | $79,800 | $153,900 |
| 2018 | $4,742 | $233,700 | $79,800 | $153,900 |
| 2017 | $4,586 | $199,900 | $72,500 | $127,400 |
| 2016 | $4,488 | $199,900 | $72,500 | $127,400 |
| 2015 | $4,488 | $199,900 | $72,500 | $127,400 |
| 2014 | $4,305 | $188,500 | $72,500 | $116,000 |
Property History
| Date | Event | Price | List to Sale | Price per Sq Ft |
|---|---|---|---|---|
| 10/31/2025 10/31/25 | For Sale | $494,900 | -- | $268 / Sq Ft |
Purchase History
| Date | Type | Sale Price | Title Company |
|---|---|---|---|
| Quit Claim Deed | -- | None Available | |
| Deed | $305,000 | -- | |
| Deed | $219,000 | -- | |
| Warranty Deed | $130,000 | -- |
Mortgage History
| Date | Status | Loan Amount | Loan Type |
|---|---|---|---|
| Previous Owner | $305,000 | Purchase Money Mortgage | |
| Previous Owner | $197,550 | Purchase Money Mortgage | |
| Previous Owner | $199,000 | No Value Available |
Source: State-Wide MLS
MLS Number: 1399190
APN: CRAN-000018-000001-001802
Disclaimer: Certain information contained herein is derived from information provided by parties other than Homes.com. All information provided is deemed reliable, but is not guaranteed to be accurate and should be independently verified.
![]() IDX information is provided exclusively for personal, non-commercial use, and may not be used for any purpose other than to identify prospective properties consumers may be interested in purchasing. Information is deemed reliable but not guaranteed.
IDX information is provided exclusively for personal, non-commercial use, and may not be used for any purpose other than to identify prospective properties consumers may be interested in purchasing. Information is deemed reliable but not guaranteed.
Copyright © 2025 State-Wide MLS, Inc. All rights reserved.
- 11 Chaple Dr
- 20 Manor Rd
- 11 Crossland Rd
- 71 Steven Dr
- 61 Crossland Rd
- 0 Natick Rd
- 54 River St Unit 4
- 61 Rose Hill Dr
- 63 Governors Hill Unit 63
- 25 Wilson St
- 780 Providence St
- 550 Wakefield St Unit 3
- 99 Walden Way
- 112 Greenwich Ave
- 8 Lily Ln Unit 8
- 81 W Pontiac St
- 744 Providence St
- 132 Prospect Hill Ave
- 114 Pontiac St
- 46 Hornbeam Dr
- 245 W Natick Rd
- 855 Providence St
- 51-53 Prospect Hill Ave Unit 2R
- 692 East Ave
- 703 Providence St Unit A
- 5 Penta St Unit 102
- 334 Knight St
- 303 Greenwich Ave
- 476 Providence St Unit 1
- 842 Oaklawn Ave Unit 2
- 268 Metro Center Blvd
- 630 Oaklawn Ave
- 227 Providence St
- 1162 Main Ave
- 47 Tanglewood Dr
- 18 Harmony St Unit 2
- 29 Brayton St
- 201 Hoffman Ave Unit 25
- 1082 Greenwich Ave Unit Suite #1
- 1082 Greenwich Ave