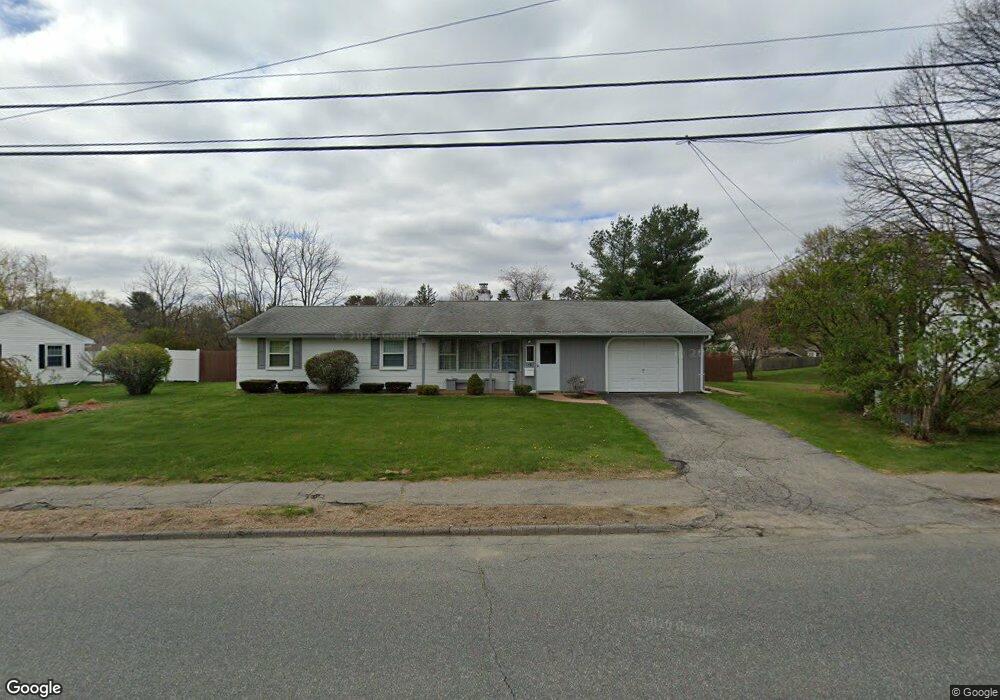
37 Frost St Framingham, MA 01701
Nobscot NeighborhoodEstimated Value: $502,000 - $584,000
3
Beds
2
Baths
1,200
Sq Ft
$462/Sq Ft
Est. Value
About This Home
This home is located at 37 Frost St, Framingham, MA 01701 and is currently estimated at $553,907, approximately $461 per square foot. 37 Frost St is a home located in Middlesex County with nearby schools including Framingham High School, MetroWest Jewish Day School, and Summit Montessori School.
Ownership History
Date
Name
Owned For
Owner Type
Purchase Details
Closed on
Sep 23, 2024
Sold by
Doris M Sheahan Ft and King
Bought by
Sheahan Dana A and Tucceri Jane
Current Estimated Value
Home Financials for this Owner
Home Financials are based on the most recent Mortgage that was taken out on this home.
Original Mortgage
$480,000
Outstanding Balance
$474,604
Interest Rate
6.47%
Mortgage Type
Purchase Money Mortgage
Estimated Equity
$79,303
Purchase Details
Closed on
Oct 18, 2018
Sold by
Sheahan Doris M
Bought by
Doris M Sheahan Ft and Sheahan
Purchase Details
Closed on
Jul 22, 1969
Bought by
Sheahan Arthur E and Sheahan Doris M
Create a Home Valuation Report for This Property
The Home Valuation Report is an in-depth analysis detailing your home's value as well as a comparison with similar homes in the area
Home Values in the Area
Average Home Value in this Area
Purchase History
| Date | Buyer | Sale Price | Title Company |
|---|---|---|---|
| Sheahan Dana A | $480,000 | None Available | |
| Sheahan Dana A | $480,000 | None Available | |
| Sheahan Dana A | $480,000 | None Available | |
| Doris M Sheahan Ft | -- | -- | |
| Doris M Sheahan Ft | -- | -- | |
| Sheahan Arthur E | -- | -- | |
| Doris M Sheahan Ft | -- | -- |
Source: Public Records
Mortgage History
| Date | Status | Borrower | Loan Amount |
|---|---|---|---|
| Open | Sheahan Dana A | $480,000 | |
| Closed | Sheahan Dana A | $480,000 | |
| Previous Owner | Sheahan Arthur E | $57,000 | |
| Previous Owner | Sheahan Arthur E | $10,000 | |
| Previous Owner | Sheahan Arthur E | $45,000 |
Source: Public Records
Tax History Compared to Growth
Tax History
| Year | Tax Paid | Tax Assessment Tax Assessment Total Assessment is a certain percentage of the fair market value that is determined by local assessors to be the total taxable value of land and additions on the property. | Land | Improvement |
|---|---|---|---|---|
| 2025 | $5,919 | $495,700 | $271,100 | $224,600 |
| 2024 | $5,820 | $467,100 | $242,200 | $224,900 |
| 2023 | $5,506 | $420,600 | $216,100 | $204,500 |
| 2022 | $5,201 | $378,500 | $196,100 | $182,400 |
| 2021 | $5,061 | $360,200 | $188,500 | $171,700 |
| 2020 | $5,081 | $339,200 | $171,300 | $167,900 |
| 2019 | $5,014 | $326,000 | $171,300 | $154,700 |
| 2018 | $4,914 | $301,100 | $164,900 | $136,200 |
| 2017 | $4,824 | $288,700 | $160,100 | $128,600 |
| 2016 | $4,727 | $272,000 | $160,100 | $111,900 |
| 2015 | $4,663 | $261,700 | $160,700 | $101,000 |
Source: Public Records
Map
Nearby Homes
- 39 Frost St
- 35 Frost St Unit 2F
- 35 Frost St Unit 2R
- 35 Frost St Unit 2
- 35 Frost St Unit 1
- 35 Frost St
- 23 Myrna Rd
- 41 Frost St
- 4 Winifred Rd
- 6 Winifred Rd
- 6 Winifred Rd
- 6 Winifred Rd Unit single fam
- 1 Cornell Rd
- 8 Winifred Rd
- 19 Myrna Rd
- 43 Frost St
- 15 Myrna Rd
- 32 Frost St
- 10 Winifred Rd
- 2 Cornell Rd