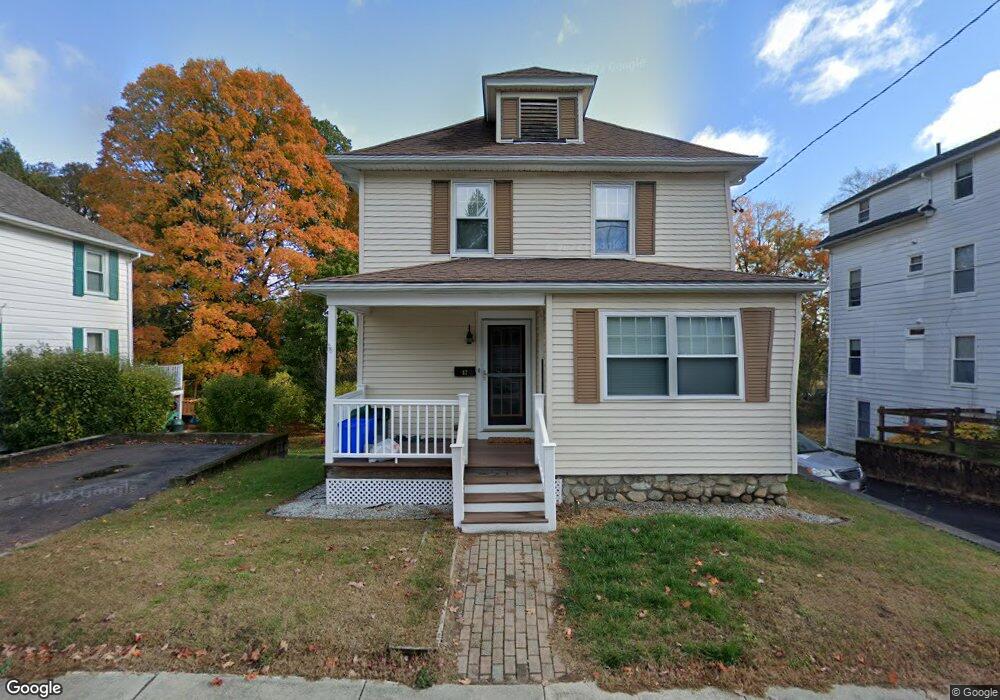
37 Grant St Milford, MA 01757
Estimated Value: $434,000 - $476,000
3
Beds
2
Baths
1,390
Sq Ft
$332/Sq Ft
Est. Value
About This Home
This home is located at 37 Grant St, Milford, MA 01757 and is currently estimated at $460,981, approximately $331 per square foot. 37 Grant St is a home located in Worcester County with nearby schools including Milford High School and Bethany Christian Academy.
Ownership History
Date
Name
Owned For
Owner Type
Purchase Details
Closed on
Aug 11, 2014
Sold by
Phelps Linda A
Bought by
Phelps-Toronto Linda A and Toronto Alfred J
Current Estimated Value
Home Financials for this Owner
Home Financials are based on the most recent Mortgage that was taken out on this home.
Original Mortgage
$167,000
Interest Rate
4.14%
Mortgage Type
New Conventional
Purchase Details
Closed on
Mar 31, 1994
Sold by
Earl William V and Earl Rhodora H
Bought by
Phelps Linda A
Create a Home Valuation Report for This Property
The Home Valuation Report is an in-depth analysis detailing your home's value as well as a comparison with similar homes in the area
Home Values in the Area
Average Home Value in this Area
Purchase History
| Date | Buyer | Sale Price | Title Company |
|---|---|---|---|
| Phelps-Toronto Linda A | -- | -- | |
| Phelps Linda A | $104,500 | -- |
Source: Public Records
Mortgage History
| Date | Status | Borrower | Loan Amount |
|---|---|---|---|
| Closed | Phelps-Toronto Linda A | $167,000 | |
| Previous Owner | Phelps Linda A | $196,000 | |
| Previous Owner | Phelps Linda A | $78,000 | |
| Previous Owner | Phelps Linda A | $65,000 |
Source: Public Records
Tax History Compared to Growth
Tax History
| Year | Tax Paid | Tax Assessment Tax Assessment Total Assessment is a certain percentage of the fair market value that is determined by local assessors to be the total taxable value of land and additions on the property. | Land | Improvement |
|---|---|---|---|---|
| 2025 | $5,194 | $405,800 | $152,400 | $253,400 |
| 2024 | $5,010 | $377,000 | $145,300 | $231,700 |
| 2023 | $5,010 | $346,700 | $132,900 | $213,800 |
| 2022 | $4,757 | $309,100 | $120,500 | $188,600 |
| 2021 | $4,372 | $273,600 | $120,500 | $153,100 |
| 2020 | $4,324 | $270,900 | $120,500 | $150,400 |
| 2019 | $3,930 | $237,600 | $120,500 | $117,100 |
| 2018 | $3,935 | $237,600 | $120,500 | $117,100 |
| 2017 | $3,680 | $219,200 | $120,500 | $98,700 |
| 2016 | $3,652 | $212,600 | $120,500 | $92,100 |
| 2015 | $3,638 | $207,300 | $115,200 | $92,100 |
Source: Public Records
Map
Nearby Homes