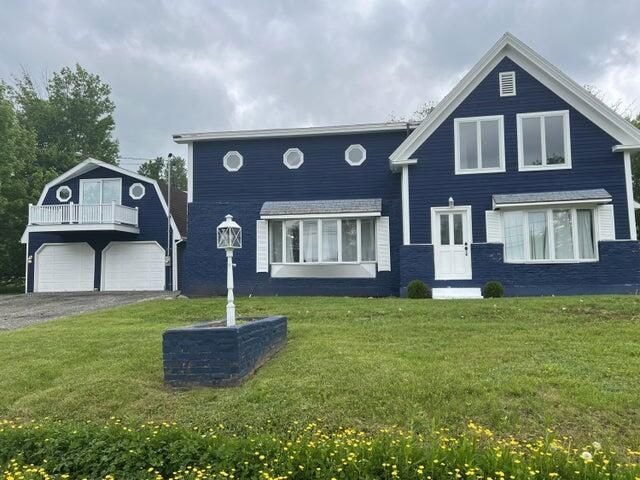
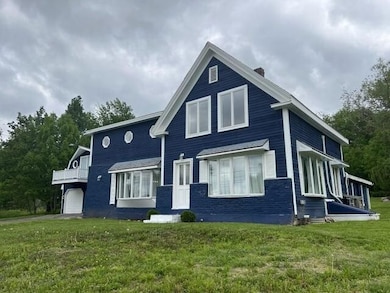
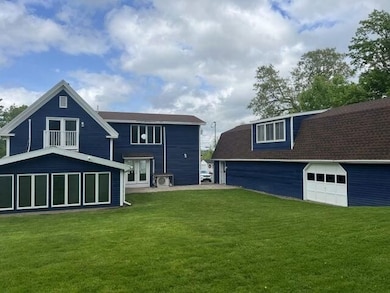
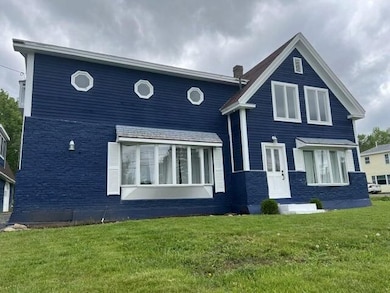
37 Hampden Rd Carmel, ME 04419
Estimated payment $2,217/month
Total Views
44,308
3
Beds
1.5
Baths
2,406
Sq Ft
$152
Price per Sq Ft
About This Home
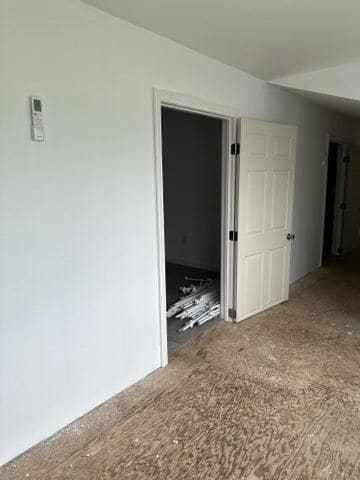
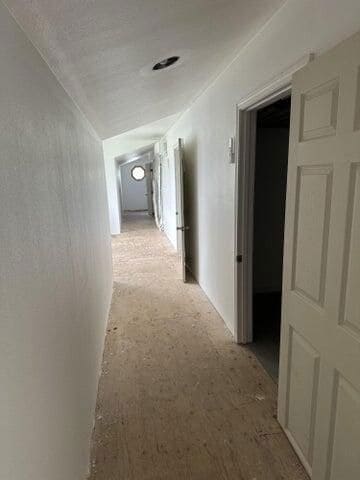
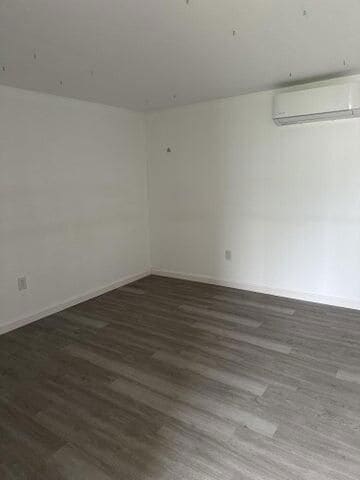
This remodeled New Englander is a must see. The large open kitchen and living room allow for easy entertaining. The spacious living room opens into a large sunroom with a post and beam ceiling and plenty of sunlight. The primary bedroom upstairs has a half-bath and there are two other large bedrooms. The large detached garage has lots of space for cars, toys or a large workshop. The upstairs has three rooms complete with heat pumps. The open backyard has ample space for playing or relaxing around the fire pit. The yard also has apple and pear trees. This home is located about 20 minutes from Bangor and about 30 minutes to Newport.
Listing Provided By

Home Details
Home Type
- Single Family
Est. Annual Taxes
- $3,269
Bedrooms and Bathrooms
- 3 Bedrooms
Utilities
- Private Water Source
- Private Sewer
Map
Create a Home Valuation Report for This Property
The Home Valuation Report is an in-depth analysis detailing your home's value as well as a comparison with similar homes in the area
Home Values in the Area
Average Home Value in this Area
Tax History
| Year | Tax Paid | Tax Assessment Tax Assessment Total Assessment is a certain percentage of the fair market value that is determined by local assessors to be the total taxable value of land and additions on the property. | Land | Improvement |
|---|---|---|---|---|
| 2024 | $3,269 | $239,500 | $30,500 | $209,000 |
| 2023 | $3,102 | $239,500 | $30,500 | $209,000 |
| 2022 | $3,018 | $239,500 | $30,500 | $209,000 |
| 2021 | $2,845 | $175,600 | $23,500 | $152,100 |
| 2020 | $2,985 | $175,600 | $23,500 | $152,100 |
| 2019 | $2,573 | $175,600 | $23,500 | $152,100 |
| 2018 | $2,573 | $175,600 | $23,500 | $152,100 |
| 2017 | $2,485 | $175,600 | $23,500 | $152,100 |
| 2016 | $2,458 | $175,600 | $23,500 | $152,100 |
| 2015 | $2,397 | $175,600 | $23,500 | $152,100 |
| 2014 | $2,397 | $175,600 | $23,500 | $152,100 |
| 2012 | $2,300 | $175,600 | $23,500 | $152,100 |
Source: Public Records
Property History
| Date | Event | Price | Change | Sq Ft Price |
|---|---|---|---|---|
| 09/02/2025 09/02/25 | For Sale | $380,000 | +4.1% | $158 / Sq Ft |
| 01/21/2025 01/21/25 | For Sale | $365,000 | +26.7% | $152 / Sq Ft |
| 01/07/2022 01/07/22 | Sold | $288,000 | +2.9% | $120 / Sq Ft |
| 11/20/2021 11/20/21 | Pending | -- | -- | -- |
| 11/12/2021 11/12/21 | For Sale | $279,900 | +218.1% | $116 / Sq Ft |
| 02/16/2021 02/16/21 | Sold | $88,000 | -2.1% | $46 / Sq Ft |
| 01/30/2021 01/30/21 | Pending | -- | -- | -- |
| 01/29/2021 01/29/21 | For Sale | $89,900 | +170.4% | $47 / Sq Ft |
| 04/09/2019 04/09/19 | Sold | $33,250 | -33.4% | $18 / Sq Ft |
| 03/21/2019 03/21/19 | Pending | -- | -- | -- |
| 02/26/2019 02/26/19 | For Sale | $49,900 | -- | $26 / Sq Ft |
Purchase History
| Date | Type | Sale Price | Title Company |
|---|---|---|---|
| Warranty Deed | -- | None Available | |
| Quit Claim Deed | -- | -- | |
| Foreclosure Deed | -- | -- | |
| Foreclosure Deed | -- | -- |
Source: Public Records
Mortgage History
| Date | Status | Loan Amount | Loan Type |
|---|---|---|---|
| Open | $288,000 | VA | |
| Previous Owner | $204,000 | Reverse Mortgage Home Equity Conversion Mortgage |
Source: Public Records
Nearby Homes
- 872 Main Rd W
- 139 Five Rd
- 315 Hampden Rd
- 323 Hampden Rd
- 142 Ash Hill Rd
- 323, 324 Lots Map 5 Hampden Rd
- 320 Fuller Rd
- 32 Perry Ln
- 299 Damascus Rd
- 81 Etna Pond Rd
- 44 Swett Rd
- 24 Hayward Rd
- 649 Streamside Ave
- 633 Streamside Ave
- 417 Shadow Ln
- 168 Bemis Rd Unit 4
- 1083 North Rd
- 1719 Dixmont Rd
- Lot 3 Shadow Ln
- 16 Old County Rd
- 7 Possum Ln
- 180 Bemis Rd Unit 2B
- 2412 Western Ave Unit E
- 2189 Carmel Rd N Unit 1
- 3 Stemar Dr
- 706 Fuller Rd Unit 4
- 2478 Us-2 Unit 1
- 9 New Boston Rd Unit 1
- 300 Phillips Rd
- 221 Emerson Mill Rd Unit 1
- 1 Mansel Rd
- 1833 Hammond St Unit 5
- 1817 Hammond St Unit 1
- 208 Rocky Rdg Dr Unit 17
- 208 Rocky Rdg Dr Unit 26
- 19 Maple St
- 792 Mudgett Rd
- 12 1st St
- 21 4th St
- 1343 Ohio St