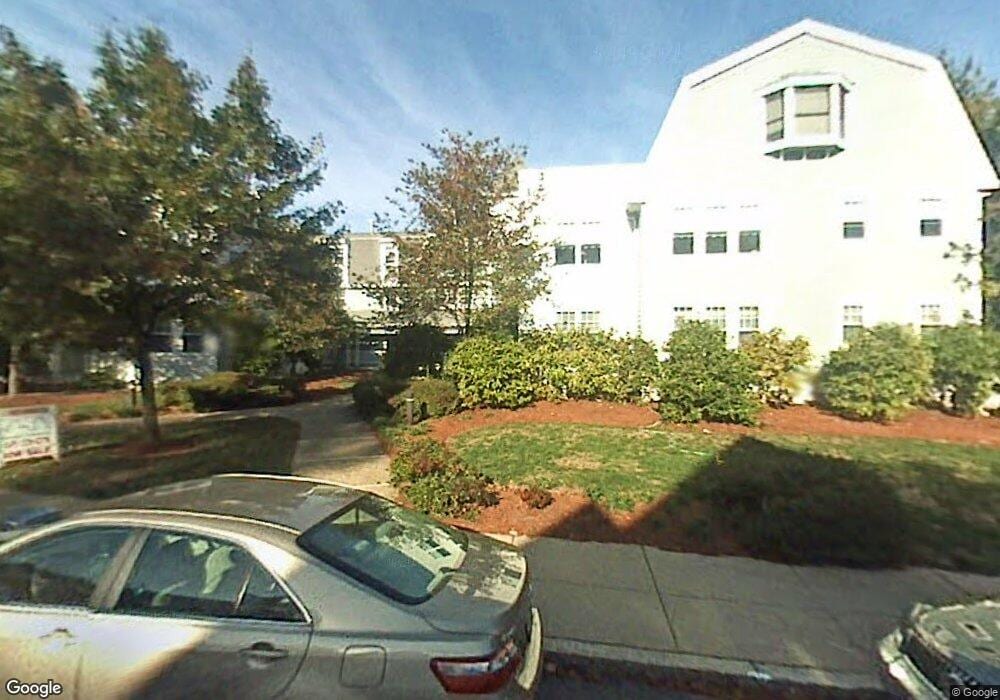
37 Hastings St Unit 204 West Roxbury, MA 02132
West Roxbury NeighborhoodEstimated Value: $457,567 - $588,000
1
Bed
1
Bath
802
Sq Ft
$640/Sq Ft
Est. Value
About This Home
This home is located at 37 Hastings St Unit 204, West Roxbury, MA 02132 and is currently estimated at $513,142, approximately $639 per square foot. 37 Hastings St Unit 204 is a home located in Suffolk County with nearby schools including Holy Name Parish School, St Theresa School, and The Roxbury Latin School.
Ownership History
Date
Name
Owned For
Owner Type
Purchase Details
Closed on
May 1, 1997
Sold by
Parkhurst Susan E
Bought by
Otoole Jeanne M
Current Estimated Value
Home Financials for this Owner
Home Financials are based on the most recent Mortgage that was taken out on this home.
Original Mortgage
$67,800
Interest Rate
7.85%
Mortgage Type
Purchase Money Mortgage
Purchase Details
Closed on
Oct 16, 1987
Sold by
Boston Chataugua
Bought by
Parkhurst Susan E
Home Financials for this Owner
Home Financials are based on the most recent Mortgage that was taken out on this home.
Original Mortgage
$97,000
Interest Rate
10.29%
Mortgage Type
Purchase Money Mortgage
Purchase Details
Closed on
Aug 24, 1987
Sold by
Boston Chatauqua
Bought by
Parkhurst Susan E
Home Financials for this Owner
Home Financials are based on the most recent Mortgage that was taken out on this home.
Original Mortgage
$97,000
Interest Rate
10.29%
Mortgage Type
Purchase Money Mortgage
Create a Home Valuation Report for This Property
The Home Valuation Report is an in-depth analysis detailing your home's value as well as a comparison with similar homes in the area
Home Values in the Area
Average Home Value in this Area
Purchase History
| Date | Buyer | Sale Price | Title Company |
|---|---|---|---|
| Otoole Jeanne M | $116,000 | -- | |
| Parkhurst Susan E | $140,000 | -- | |
| Parkhurst Susan E | $140,000 | -- |
Source: Public Records
Mortgage History
| Date | Status | Borrower | Loan Amount |
|---|---|---|---|
| Open | Parkhurst Susan E | $85,000 | |
| Closed | Parkhurst Susan E | $67,800 | |
| Previous Owner | Parkhurst Susan E | $97,000 | |
| Closed | Parkhurst Susan E | $23,200 |
Source: Public Records
Tax History Compared to Growth
Tax History
| Year | Tax Paid | Tax Assessment Tax Assessment Total Assessment is a certain percentage of the fair market value that is determined by local assessors to be the total taxable value of land and additions on the property. | Land | Improvement |
|---|---|---|---|---|
| 2025 | $4,653 | $401,800 | $0 | $401,800 |
| 2024 | $4,237 | $388,700 | $0 | $388,700 |
| 2023 | $4,051 | $377,200 | $0 | $377,200 |
| 2022 | $3,909 | $359,300 | $0 | $359,300 |
| 2021 | $3,834 | $359,300 | $0 | $359,300 |
| 2020 | $3,192 | $302,300 | $0 | $302,300 |
| 2019 | $2,978 | $282,500 | $0 | $282,500 |
| 2018 | $2,845 | $271,500 | $0 | $271,500 |
| 2017 | $2,764 | $261,000 | $0 | $261,000 |
| 2016 | $2,684 | $244,000 | $0 | $244,000 |
| 2015 | $2,646 | $218,500 | $0 | $218,500 |
| 2014 | $2,521 | $200,400 | $0 | $200,400 |
Source: Public Records
Map
Nearby Homes
- 37 Hastings St Unit 103
- 110 Park St Unit 3
- 1789 Centre St Unit 202
- 22 Bellevue St
- 55 Redlands Rd
- 37 Pomfret St
- 19 Pomfret St
- 76 Potomac St
- 168 Maple St
- 539 Lagrange St
- 76 Vermont St
- 416 Belgrade Ave Unit 25
- 425 Lagrange St Unit 203
- 10 Burwell Rd
- 54 Sturges Rd
- 183 Temple St
- 701 Vfw Pkwy
- 9 Carroll St
- 37 Montvale St Unit 2
- 311 Belgrade Ave
- 37 Hastings St Unit 305
- 37 Hastings St Unit 304
- 37 Hastings St Unit 303
- 37 Hastings St Unit 302
- 37 Hastings St Unit 301
- 37 Hastings St Unit 206
- 37 Hastings St Unit 205
- 37 Hastings St Unit 203
- 37 Hastings St Unit 202
- 37 Hastings St Unit 201
- 37 Hastings St Unit 106
- 37 Hastings St Unit 105
- 37 Hastings St Unit 104
- 37 Hastings St Unit 102
- 37 Hastings St Unit 101
- 37 Hastings St Unit 204,1
- 37 Hastings St Unit 104,37
- 37 Hastings St Unit 305,1
- 33 Hastings St Unit 35
- 57 Henshaw Terrace