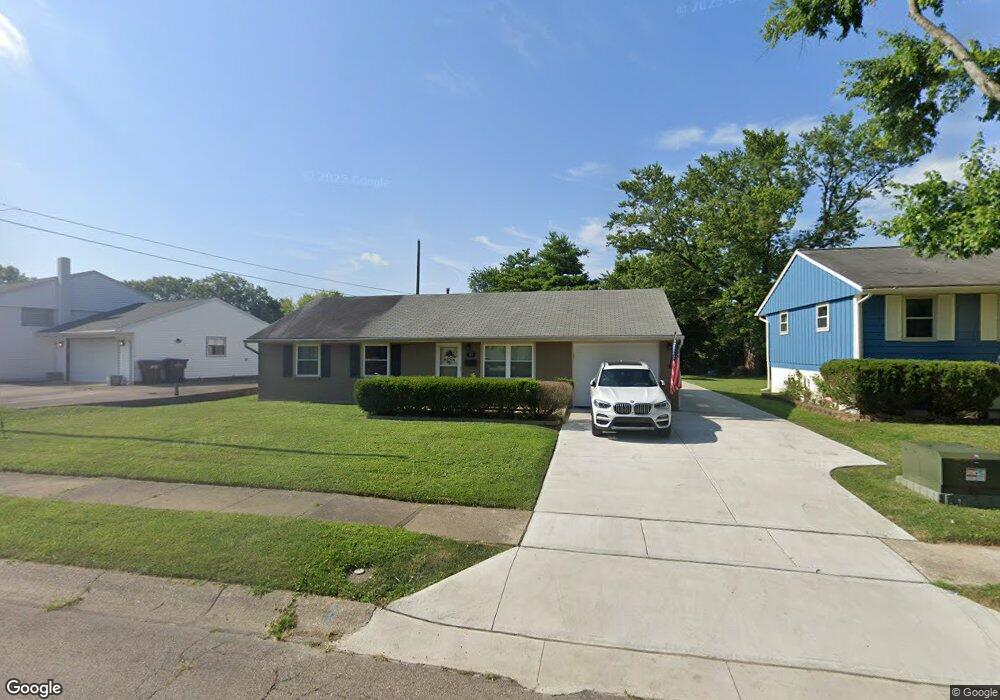
37 John St Franklin, OH 45005
Estimated Value: $176,000 - $215,000
3
Beds
2
Baths
999
Sq Ft
$192/Sq Ft
Est. Value
About This Home
This home is located at 37 John St, Franklin, OH 45005 and is currently estimated at $192,180, approximately $192 per square foot. 37 John St is a home located in Warren County with nearby schools including Franklin High School and The CinDay Academy.
Ownership History
Date
Name
Owned For
Owner Type
Purchase Details
Closed on
Jan 29, 2021
Sold by
Sallee Merle D
Bought by
Sallee Michael W
Current Estimated Value
Home Financials for this Owner
Home Financials are based on the most recent Mortgage that was taken out on this home.
Original Mortgage
$72,750
Outstanding Balance
$51,572
Interest Rate
2.6%
Mortgage Type
New Conventional
Estimated Equity
$140,608
Purchase Details
Closed on
Nov 25, 2020
Sold by
Riley Ernest L
Bought by
Sallee Merle D
Purchase Details
Closed on
Jan 6, 2020
Sold by
Estate Of Beverly J Riley
Bought by
Riley Ernest L
Create a Home Valuation Report for This Property
The Home Valuation Report is an in-depth analysis detailing your home's value as well as a comparison with similar homes in the area
Home Values in the Area
Average Home Value in this Area
Purchase History
| Date | Buyer | Sale Price | Title Company |
|---|---|---|---|
| Sallee Michael W | $75,000 | Landsel Title | |
| Sallee Merle D | $39,000 | None Available | |
| Riley Ernest L | -- | None Available |
Source: Public Records
Mortgage History
| Date | Status | Borrower | Loan Amount |
|---|---|---|---|
| Open | Sallee Michael W | $72,750 |
Source: Public Records
Tax History
| Year | Tax Paid | Tax Assessment Tax Assessment Total Assessment is a certain percentage of the fair market value that is determined by local assessors to be the total taxable value of land and additions on the property. | Land | Improvement |
|---|---|---|---|---|
| 2025 | $2,029 | $43,150 | $15,750 | $27,400 |
| 2024 | $2,029 | $43,150 | $15,750 | $27,400 |
| 2023 | $1,657 | $31,580 | $9,684 | $21,896 |
| 2022 | $1,495 | $29,061 | $9,685 | $19,376 |
| 2021 | $1,295 | $26,544 | $9,685 | $16,860 |
| 2020 | $1,694 | $30,615 | $7,875 | $22,740 |
| 2019 | $1,540 | $30,615 | $7,875 | $22,740 |
| 2018 | $1,519 | $30,615 | $7,875 | $22,740 |
| 2017 | $1,578 | $28,658 | $7,480 | $21,179 |
| 2016 | $1,609 | $28,658 | $7,480 | $21,179 |
| 2015 | $1,609 | $28,658 | $7,480 | $21,179 |
| 2014 | $1,650 | $28,660 | $7,480 | $21,180 |
| 2013 | $1,399 | $33,520 | $8,750 | $24,770 |
Source: Public Records
Map
Nearby Homes
- 760 David Blvd
- 747 David Blvd
- 657 E 2nd St
- 651 E 2nd St
- 779 Martha Dr
- 33 Stadia Dr
- 520 Arlington Ave
- 551 E 2nd St
- 995 E 4th St
- 388 Thomas Dr
- 0 Victoria Dr Unit 942075
- 0 Victoria Dr Unit 1852824
- 202 E 2nd St
- 212 Rossman Ct
- 210 N Riley Blvd
- 25 Copperhead Trail
- 45 Copperhead Trail
- 139 E 6th St
- 5 S River St
- 228 Bridge St
Your Personal Tour Guide
Ask me questions while you tour the home.