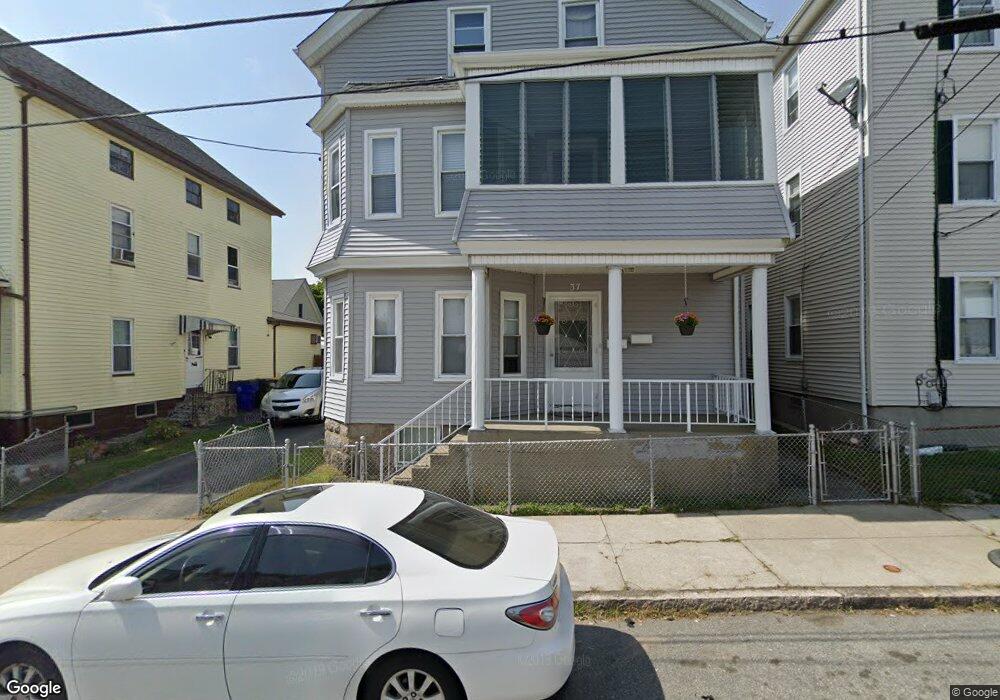
37 Lapham St Fall River, MA 02721
Niagara NeighborhoodEstimated Value: $476,828 - $633,000
6
Beds
2
Baths
2,995
Sq Ft
$188/Sq Ft
Est. Value
About This Home
This home is located at 37 Lapham St, Fall River, MA 02721 and is currently estimated at $561,957, approximately $187 per square foot. 37 Lapham St is a home located in Bristol County with nearby schools including William S Greene, Matthew J. Kuss Middle School, and B M C Durfee High School.
Ownership History
Date
Name
Owned For
Owner Type
Purchase Details
Closed on
Nov 30, 2001
Sold by
Pacheco Nelson M
Bought by
Bernard Ronald L and Bernard Ana C
Current Estimated Value
Home Financials for this Owner
Home Financials are based on the most recent Mortgage that was taken out on this home.
Original Mortgage
$170,327
Interest Rate
6.66%
Mortgage Type
Purchase Money Mortgage
Purchase Details
Closed on
Apr 30, 1996
Sold by
Fronczek Doris B
Bought by
Pacheco Nelson M
Create a Home Valuation Report for This Property
The Home Valuation Report is an in-depth analysis detailing your home's value as well as a comparison with similar homes in the area
Home Values in the Area
Average Home Value in this Area
Purchase History
| Date | Buyer | Sale Price | Title Company |
|---|---|---|---|
| Bernard Ronald L | $173,000 | -- | |
| Pacheco Nelson M | $110,000 | -- |
Source: Public Records
Mortgage History
| Date | Status | Borrower | Loan Amount |
|---|---|---|---|
| Open | Pacheco Nelson M | $20,000 | |
| Open | Pacheco Nelson M | $173,500 | |
| Closed | Pacheco Nelson M | $170,327 | |
| Previous Owner | Pacheco Nelson M | $107,000 |
Source: Public Records
Tax History
| Year | Tax Paid | Tax Assessment Tax Assessment Total Assessment is a certain percentage of the fair market value that is determined by local assessors to be the total taxable value of land and additions on the property. | Land | Improvement |
|---|---|---|---|---|
| 2025 | $5,471 | $477,800 | $107,400 | $370,400 |
| 2024 | $4,981 | $433,500 | $103,400 | $330,100 |
| 2023 | $4,530 | $369,200 | $85,500 | $283,700 |
| 2022 | $4,175 | $330,800 | $81,400 | $249,400 |
| 2021 | $3,813 | $275,700 | $77,400 | $198,300 |
| 2020 | $3,384 | $234,200 | $76,300 | $157,900 |
| 2019 | $3,199 | $219,400 | $73,500 | $145,900 |
| 2018 | $3,029 | $207,200 | $79,600 | $127,600 |
| 2017 | $2,744 | $196,000 | $75,800 | $120,200 |
| 2016 | $2,696 | $197,800 | $80,700 | $117,100 |
| 2015 | $2,587 | $197,800 | $80,700 | $117,100 |
| 2014 | $2,595 | $206,300 | $78,300 | $128,000 |
Source: Public Records
Map
Nearby Homes
- 304 Cambridge St
- 405 Warren St
- 231 Lapham St
- 71 Smith St
- 472 Buffinton St
- 472 Buffinton St (Ns)
- 311 S Oxford St
- 11 Foster St
- 1350 Rodman St
- 364 Tecumseh St
- 94 Snell St
- 21 Boyden St
- 545 Brayton Ave
- 20 Reeves St
- 000 Lawrence St
- 1-11 Lawrence St
- 188-194 Nashua St
- 1 Lawrence St Unit 1
- 132 Lonsdale St
- 10 Aberdeen St
Your Personal Tour Guide
Ask me questions while you tour the home.