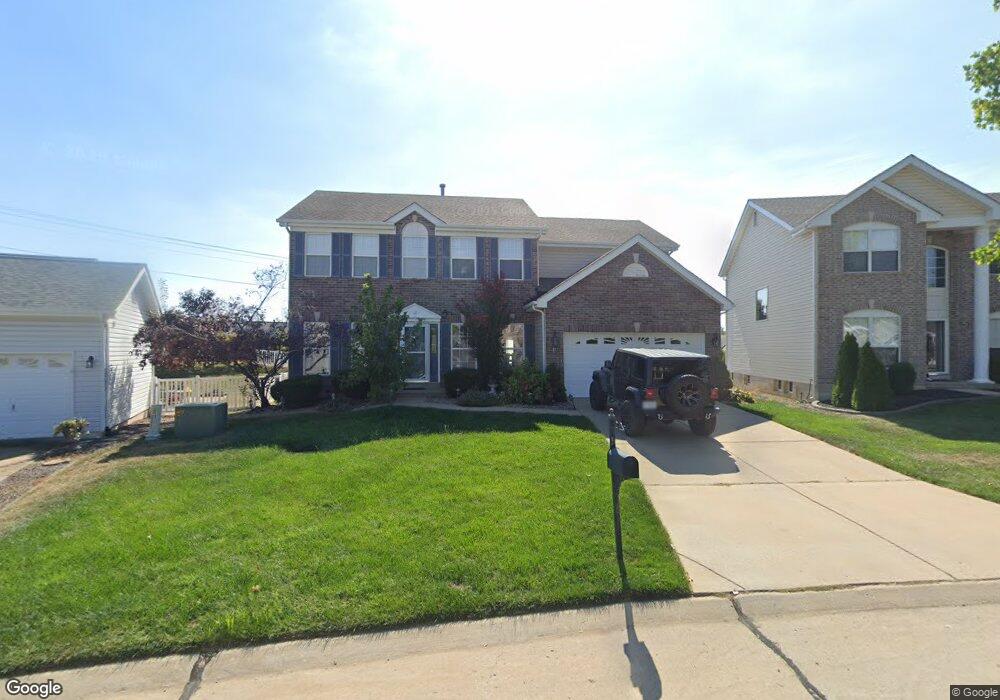
37 Logan Crossing Cir O Fallon, MO 63366
Estimated Value: $429,000 - $458,000
4
Beds
3
Baths
2,604
Sq Ft
$168/Sq Ft
Est. Value
About This Home
This home is located at 37 Logan Crossing Cir, O Fallon, MO 63366 and is currently estimated at $438,665, approximately $168 per square foot. 37 Logan Crossing Cir is a home located in St. Charles County with nearby schools including Mount Hope Elementary School, Fort Zumwalt North Middle School, and Fort Zumwalt North High School.
Ownership History
Date
Name
Owned For
Owner Type
Purchase Details
Closed on
Nov 17, 2020
Sold by
Miller Corey G and Miller Casie L
Bought by
Miller Corey G
Current Estimated Value
Home Financials for this Owner
Home Financials are based on the most recent Mortgage that was taken out on this home.
Original Mortgage
$193,000
Interest Rate
2.8%
Mortgage Type
New Conventional
Purchase Details
Closed on
Dec 12, 2011
Sold by
Gray Kevin J and Gray Kelly M
Bought by
Miller Corey G and Miller Casie L
Home Financials for this Owner
Home Financials are based on the most recent Mortgage that was taken out on this home.
Original Mortgage
$225,000
Interest Rate
4.03%
Mortgage Type
New Conventional
Purchase Details
Closed on
Dec 28, 2005
Sold by
Mcbride & Son Homes Inc
Bought by
Gray Kevin J and Gray Kelly M
Home Financials for this Owner
Home Financials are based on the most recent Mortgage that was taken out on this home.
Original Mortgage
$218,010
Interest Rate
5.87%
Mortgage Type
Fannie Mae Freddie Mac
Create a Home Valuation Report for This Property
The Home Valuation Report is an in-depth analysis detailing your home's value as well as a comparison with similar homes in the area
Home Values in the Area
Average Home Value in this Area
Purchase History
| Date | Buyer | Sale Price | Title Company |
|---|---|---|---|
| Miller Corey G | -- | Boston National Title | |
| Miller Corey G | $245,000 | Sec | |
| Gray Kevin J | -- | Security Title |
Source: Public Records
Mortgage History
| Date | Status | Borrower | Loan Amount |
|---|---|---|---|
| Previous Owner | Miller Corey G | $193,000 | |
| Previous Owner | Miller Corey G | $225,000 | |
| Previous Owner | Gray Kevin J | $218,010 |
Source: Public Records
Tax History Compared to Growth
Tax History
| Year | Tax Paid | Tax Assessment Tax Assessment Total Assessment is a certain percentage of the fair market value that is determined by local assessors to be the total taxable value of land and additions on the property. | Land | Improvement |
|---|---|---|---|---|
| 2025 | $4,720 | $77,561 | -- | -- |
| 2023 | $4,722 | $71,488 | $0 | $0 |
| 2022 | $3,938 | $55,410 | $0 | $0 |
| 2021 | $3,941 | $55,410 | $0 | $0 |
| 2020 | $3,737 | $50,871 | $0 | $0 |
| 2019 | $3,746 | $50,871 | $0 | $0 |
| 2018 | $3,835 | $49,746 | $0 | $0 |
| 2017 | $3,791 | $49,746 | $0 | $0 |
| 2016 | $3,351 | $43,796 | $0 | $0 |
| 2015 | $3,116 | $43,796 | $0 | $0 |
| 2014 | $2,944 | $40,684 | $0 | $0 |
Source: Public Records
Map
Nearby Homes
- 1466 Koch Rd
- 23 New Freedom Way
- 421 Dames Park Dr
- 419 Dames Park Dr
- 409 Dames Park Dr
- 103 Roxbury Dr
- 223 England Dr
- 1317 New Charter Ln
- 765 Koch Rd
- 0 Matteson Blvd
- 7.19 Acres Matteson Blvd
- 3.59 Acres Matteson Blvd
- 3.6 Acres Matteson Blvd
- 1342 Woodgrove Park Dr
- 12 Warshire Ct Unit 67A
- 1384 Deerfield Estates Dr
- 9 Spring Ct
- 863 Emge Rd
- 116 Stone Ridge Meadows Dr
- 3 Jamesport Ct
- 35 Logan Crossing Cir
- 39 Logan Crossing Cir
- 117 Park Ridge Dr
- 113 Park Ridge Dr
- 33 Logan Crossing Cir
- 41 Logan Crossing Cir
- 121 Park Ridge Dr
- 359 Autumn Forest Dr
- 363 Autumn Forest Dr
- 34 Logan Crossing Cir
- 38 Logan Crossing Cir
- 355 Autumn Forest Dr
- 31 Logan Crossing Cir
- 206 Roxbury Dr
- 125 Park Ridge Dr
- 109 Park Ridge Dr
- 43 Logan Crossing Cir
- 30 Logan Crossing Cir
- 42 Logan Crossing Cir
- 208 Roxbury Dr