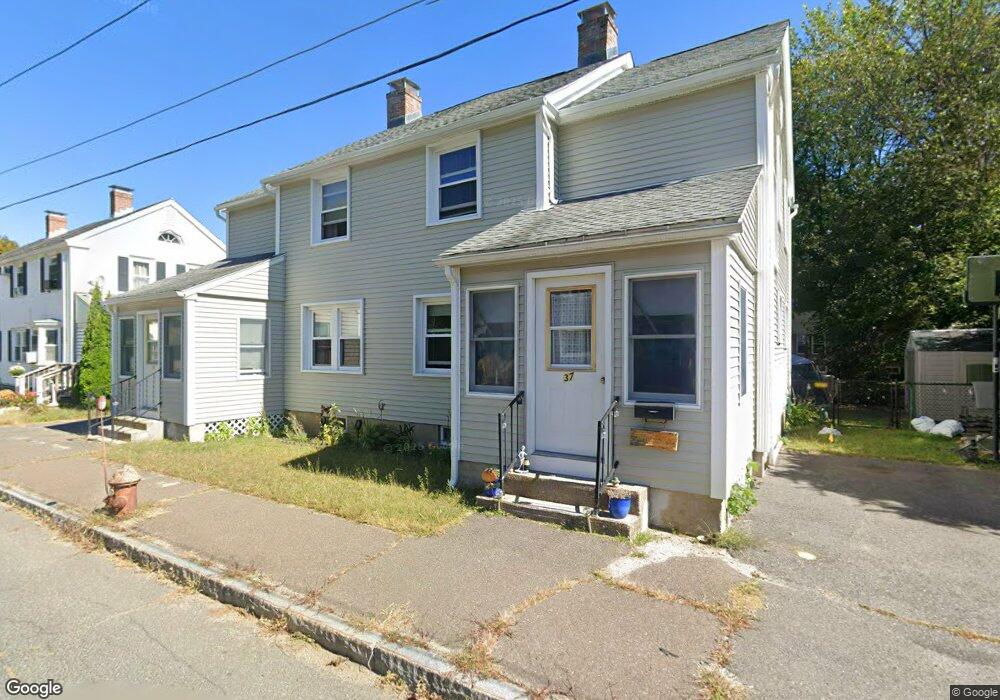
37 Ridgewood Terrace Unit 39 Easthampton, MA 01027
Estimated Value: $305,000 - $383,461
6
Beds
4
Baths
2,250
Sq Ft
$157/Sq Ft
Est. Value
About This Home
This home is located at 37 Ridgewood Terrace Unit 39, Easthampton, MA 01027 and is currently estimated at $352,615, approximately $156 per square foot. 37 Ridgewood Terrace Unit 39 is a home located in Hampshire County with nearby schools including Easthampton High School, Hilltown Cooperative Charter Public School, and Tri-County Schools.
Ownership History
Date
Name
Owned For
Owner Type
Purchase Details
Closed on
Sep 8, 2016
Sold by
Brown Thomas W and Brown Diane M
Bought by
Fiverobin Llc
Current Estimated Value
Home Financials for this Owner
Home Financials are based on the most recent Mortgage that was taken out on this home.
Original Mortgage
$420,000
Outstanding Balance
$336,018
Interest Rate
3.48%
Mortgage Type
Stand Alone Refi Refinance Of Original Loan
Estimated Equity
$16,597
Purchase Details
Closed on
Jan 21, 1994
Sold by
Easthampton Sb
Bought by
Brown James R and Brown Lorraine M
Home Financials for this Owner
Home Financials are based on the most recent Mortgage that was taken out on this home.
Original Mortgage
$50,000
Interest Rate
7.08%
Mortgage Type
Purchase Money Mortgage
Purchase Details
Closed on
Sep 27, 1993
Sold by
Lamountain Bernard L
Bought by
Easthampton Sb
Create a Home Valuation Report for This Property
The Home Valuation Report is an in-depth analysis detailing your home's value as well as a comparison with similar homes in the area
Home Values in the Area
Average Home Value in this Area
Purchase History
| Date | Buyer | Sale Price | Title Company |
|---|---|---|---|
| Fiverobin Llc | -- | -- | |
| Fiverobin Llc | $164,399 | -- | |
| Brown James R | $30,000 | -- | |
| Easthampton Sb | $57,500 | -- |
Source: Public Records
Mortgage History
| Date | Status | Borrower | Loan Amount |
|---|---|---|---|
| Open | Fiverobin Llc | $420,000 | |
| Previous Owner | Easthampton Sb | $50,000 |
Source: Public Records
Tax History Compared to Growth
Tax History
| Year | Tax Paid | Tax Assessment Tax Assessment Total Assessment is a certain percentage of the fair market value that is determined by local assessors to be the total taxable value of land and additions on the property. | Land | Improvement |
|---|---|---|---|---|
| 2025 | $4,579 | $335,000 | $83,200 | $251,800 |
| 2024 | $4,412 | $325,400 | $80,800 | $244,600 |
| 2023 | $3,304 | $225,500 | $63,700 | $161,800 |
| 2022 | $3,728 | $225,500 | $63,700 | $161,800 |
| 2021 | $4,305 | $223,700 | $63,700 | $160,000 |
| 2020 | $4,005 | $225,500 | $63,700 | $161,800 |
| 2019 | $2,930 | $189,500 | $63,700 | $125,800 |
| 2018 | $2,859 | $178,700 | $60,100 | $118,600 |
| 2017 | $2,801 | $172,800 | $57,800 | $115,000 |
| 2016 | $2,778 | $178,200 | $57,800 | $120,400 |
| 2015 | $2,700 | $178,200 | $57,800 | $120,400 |
Source: Public Records
Map
Nearby Homes
- 52-54 Everett St
- 12 Glen Cove Place Unit B
- 10 Glen Cove Place Unit A
- 98 Everett St
- 2 Clinton St
- 33 Knipfer Ave
- 19 Nicols Way Unit 19
- 108 Parsons St
- 38 West St
- 52 Williston Ave
- 5 Lownds Ave
- 33 Howard Ave
- 78 Holyoke St
- 125 Park St
- 2 Little St
- M143 &152 Glendale St
- 385 Main St
- 41 South St Unit 11
- 5 Laurin Ln
- 6 S St & Abutting Lots
- 41 Ridgewood Terrace Unit 43
- 33 Ridgewood Terrace Unit 35
- 36 Ridgewood Terrace Unit 38
- 14 Pleasant Green W Unit 16
- 32 Ridgewood Terrace Unit 34
- 32-34 Ridgewood Terrace
- 42 Ridegwood Terrace Unit 42
- 40 Ridgewood Terrace Unit 42
- 45-47 Ridgewood Terrace
- 45 Ridgewood Terrace Unit 47
- 49 Ridgewood Terrace Unit 51
- 145 Pleasant St
- 145 Pleasant St Unit 2
- 26 Pleasant Green W Unit 28
- 44 Ridgewood Terrace Unit 46
- 139 Pleasant St
- 131-135 Pleasant St Unit 3
- 53 Ridgewood Terrace Unit 55
- 53-55 Ridgewood Terrace
- 48 Ridgewood Terrace Unit 50