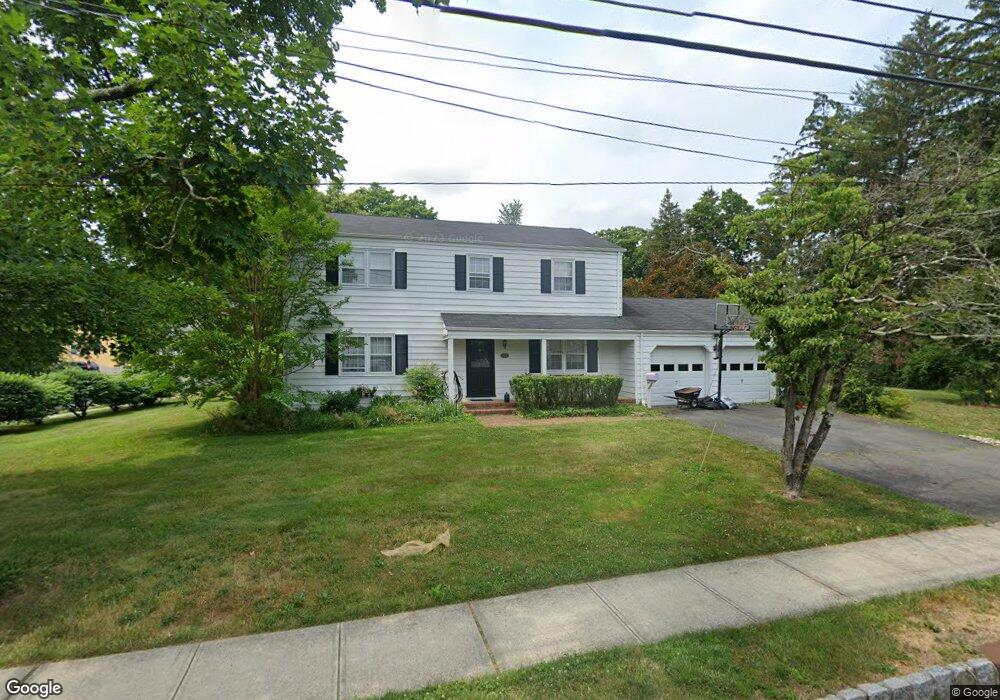
370 Ewing St Princeton, NJ 08540
Estimated Value: $1,161,000 - $1,286,000
--
Bed
--
Bath
1,850
Sq Ft
$668/Sq Ft
Est. Value
About This Home
This home is located at 370 Ewing St, Princeton, NJ 08540 and is currently estimated at $1,235,541, approximately $667 per square foot. 370 Ewing St is a home located in Mercer County with nearby schools including Community Park Elementary School, Princeton Middle School, and Princeton High School.
Ownership History
Date
Name
Owned For
Owner Type
Purchase Details
Closed on
Sep 5, 2002
Sold by
Johnson Paul
Bought by
Puchalla Jason and Staggs Suzanne
Current Estimated Value
Purchase Details
Closed on
Apr 14, 1999
Sold by
Unitarian Church
Bought by
Johnson Paul and Rowan Carol
Home Financials for this Owner
Home Financials are based on the most recent Mortgage that was taken out on this home.
Original Mortgage
$94,300
Interest Rate
7.02%
Create a Home Valuation Report for This Property
The Home Valuation Report is an in-depth analysis detailing your home's value as well as a comparison with similar homes in the area
Home Values in the Area
Average Home Value in this Area
Purchase History
| Date | Buyer | Sale Price | Title Company |
|---|---|---|---|
| Puchalla Jason | $505,000 | -- | |
| Johnson Paul | $100,300 | -- |
Source: Public Records
Mortgage History
| Date | Status | Borrower | Loan Amount |
|---|---|---|---|
| Previous Owner | Johnson Paul | $94,300 |
Source: Public Records
Tax History Compared to Growth
Tax History
| Year | Tax Paid | Tax Assessment Tax Assessment Total Assessment is a certain percentage of the fair market value that is determined by local assessors to be the total taxable value of land and additions on the property. | Land | Improvement |
|---|---|---|---|---|
| 2025 | $16,388 | $615,400 | $352,000 | $263,400 |
| 2024 | $15,471 | $615,400 | $352,000 | $263,400 |
| 2023 | $15,471 | $615,400 | $352,000 | $263,400 |
| 2022 | $14,967 | $615,400 | $352,000 | $263,400 |
| 2021 | $15,010 | $615,400 | $352,000 | $263,400 |
| 2020 | $14,893 | $615,400 | $352,000 | $263,400 |
| 2019 | $14,597 | $615,400 | $352,000 | $263,400 |
| 2018 | $14,351 | $615,400 | $352,000 | $263,400 |
| 2017 | $14,154 | $615,400 | $352,000 | $263,400 |
| 2016 | $12,952 | $572,100 | $337,000 | $235,100 |
| 2015 | $12,655 | $572,100 | $337,000 | $235,100 |
| 2014 | $12,500 | $572,100 | $337,000 | $235,100 |
Source: Public Records
Map
Nearby Homes