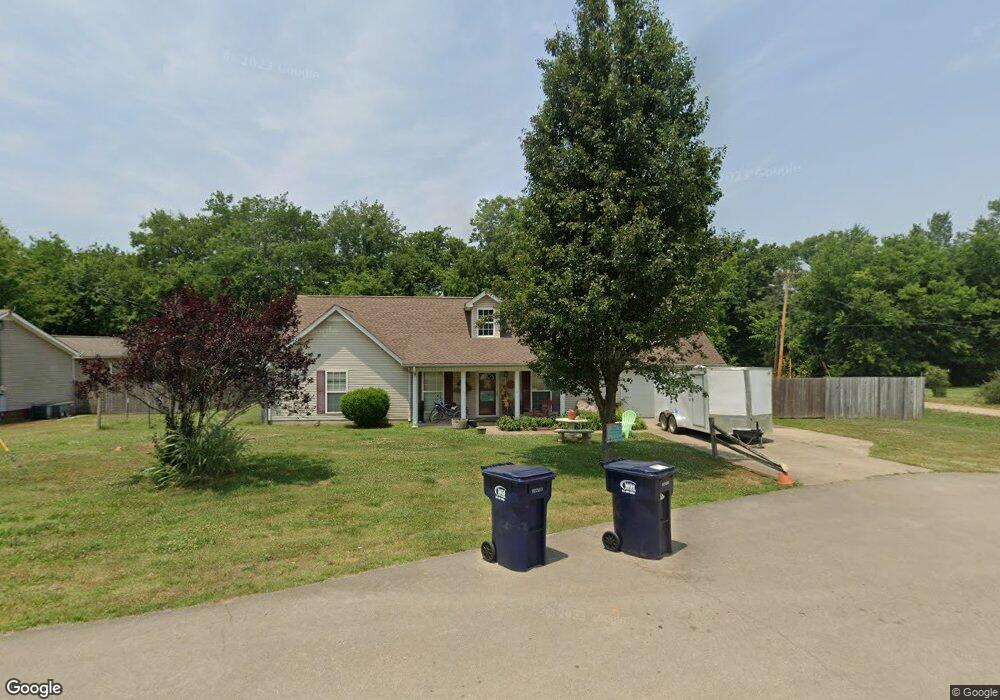
370 Tarpley Ave Cornersville, TN 37047
Estimated Value: $322,513 - $416,000
3
Beds
2
Baths
1,900
Sq Ft
$187/Sq Ft
Est. Value
About This Home
This home is located at 370 Tarpley Ave, Cornersville, TN 37047 and is currently estimated at $354,878, approximately $186 per square foot. 370 Tarpley Ave is a home located in Marshall County with nearby schools including Cornersville Elementary School and Cornersville School.
Ownership History
Date
Name
Owned For
Owner Type
Purchase Details
Closed on
Nov 21, 2014
Sold by
Neill Jennifer Leigh
Bought by
Fox Matt and Fox Mary
Current Estimated Value
Home Financials for this Owner
Home Financials are based on the most recent Mortgage that was taken out on this home.
Original Mortgage
$123,226
Interest Rate
4.37%
Mortgage Type
FHA
Purchase Details
Closed on
Mar 11, 2008
Sold by
Jennifer Watson
Bought by
Jeffrey Neill and Jeffrey Jennifer
Purchase Details
Closed on
Sep 29, 2004
Sold by
David Jent
Bought by
Jennifer Watson
Purchase Details
Closed on
Aug 13, 2003
Bought by
Jent David Ross Tate
Create a Home Valuation Report for This Property
The Home Valuation Report is an in-depth analysis detailing your home's value as well as a comparison with similar homes in the area
Home Values in the Area
Average Home Value in this Area
Purchase History
| Date | Buyer | Sale Price | Title Company |
|---|---|---|---|
| Fox Matt | $125,500 | -- | |
| Jeffrey Neill | -- | -- | |
| Jennifer Watson | $13,750 | -- | |
| Jent David Ross Tate | $125,000 | -- |
Source: Public Records
Mortgage History
| Date | Status | Borrower | Loan Amount |
|---|---|---|---|
| Open | Fox Matt | $167,000 | |
| Closed | Fox Matt | $154,000 | |
| Closed | Fox Matt | $148,453 | |
| Closed | Fox Matt | $129,731 | |
| Closed | Fox Matt | $123,226 | |
| Previous Owner | Neill Jeffrey Ray | $145,041 | |
| Previous Owner | Neill Jennifer Leigh | $137,566 | |
| Previous Owner | Jennifer Watson | $16,135 | |
| Previous Owner | Watson Jennifer | $115,000 | |
| Previous Owner | Watson Jennifer | $109,800 |
Source: Public Records
Tax History Compared to Growth
Tax History
| Year | Tax Paid | Tax Assessment Tax Assessment Total Assessment is a certain percentage of the fair market value that is determined by local assessors to be the total taxable value of land and additions on the property. | Land | Improvement |
|---|---|---|---|---|
| 2024 | -- | $66,650 | $5,000 | $61,650 |
| 2023 | $1,679 | $66,650 | $5,000 | $61,650 |
| 2022 | $1,672 | $66,650 | $5,000 | $61,650 |
| 2021 | $1,582 | $40,425 | $3,000 | $37,425 |
| 2020 | $1,522 | $40,425 | $3,000 | $37,425 |
| 2019 | $1,522 | $38,925 | $3,000 | $35,925 |
| 2018 | $1,441 | $38,925 | $3,000 | $35,925 |
| 2017 | $1,441 | $38,925 | $3,000 | $35,925 |
| 2016 | $1,409 | $33,125 | $3,000 | $30,125 |
| 2015 | $1,408 | $33,125 | $3,000 | $30,125 |
| 2014 | $1,408 | $33,125 | $3,000 | $30,125 |
Source: Public Records
Map
Nearby Homes
- 106 Polk St
- 114 Polk St
- 127 E Hill St
- 207 W Hill St
- 208 S Mulberry St
- 114 Elm St
- 200 Tarpley Ave
- 3 Hatchett Hollow Rd
- 222 Hatchett Hollow Rd
- 104 Terry Ln
- 203 Terry Ln
- 502 S Main St
- 105 Fairview Ave
- 109 Fairview Ave
- 113 Fairview Ave
- 307 Front View St
- 121 Talladega Way
- 2733 Mcconnell Rd
- 315 Daytona Dr
- 300 Daytona Dr