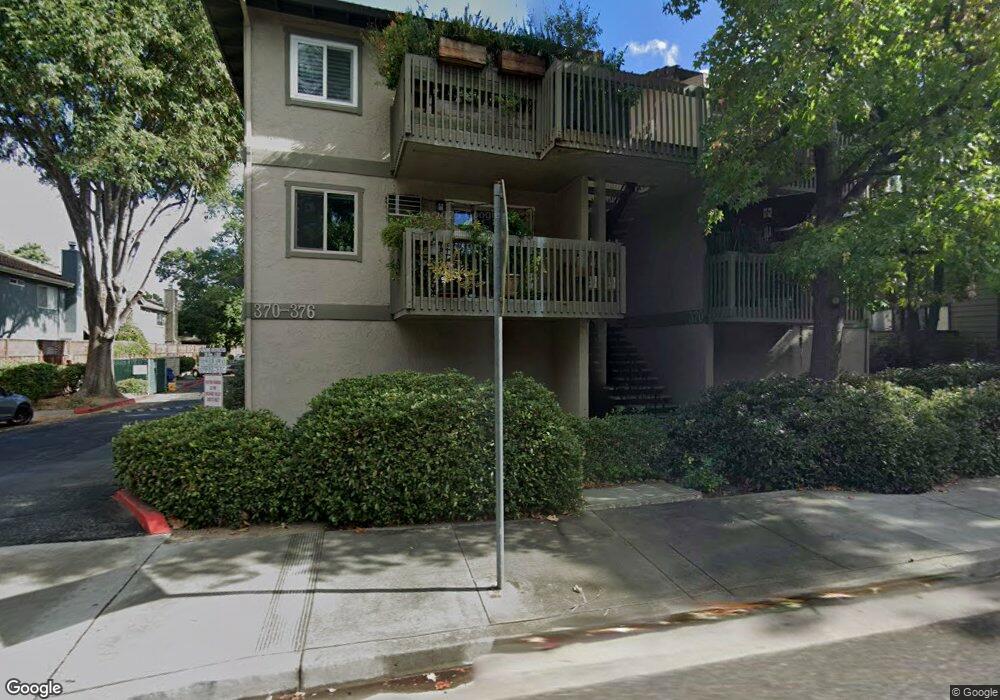
370 Union Ave Unit C Campbell, CA 95008
Cambrian NeighborhoodEstimated Value: $755,313 - $900,000
2
Beds
2
Baths
1,065
Sq Ft
$803/Sq Ft
Est. Value
About This Home
This home is located at 370 Union Ave Unit C, Campbell, CA 95008 and is currently estimated at $855,578, approximately $803 per square foot. 370 Union Ave Unit C is a home located in Santa Clara County with nearby schools including Bagby Elementary School, Branham High School, and Fammatre Elementary School.
Ownership History
Date
Name
Owned For
Owner Type
Purchase Details
Closed on
Nov 17, 2012
Sold by
Langlais Robert R and Langlais Robert R
Bought by
Langlais Robert R and Langlais Yihong
Current Estimated Value
Purchase Details
Closed on
Sep 12, 2007
Sold by
Langlais Robert R and Langlais Yihong
Bought by
Langlais Robert R and Langlais Yihong
Home Financials for this Owner
Home Financials are based on the most recent Mortgage that was taken out on this home.
Original Mortgage
$195,000
Interest Rate
6.5%
Mortgage Type
New Conventional
Purchase Details
Closed on
Aug 19, 2003
Sold by
Langlais Robert R
Bought by
Langlais Robert R and Langlais Yihog
Home Financials for this Owner
Home Financials are based on the most recent Mortgage that was taken out on this home.
Original Mortgage
$200,000
Interest Rate
5.46%
Mortgage Type
Purchase Money Mortgage
Create a Home Valuation Report for This Property
The Home Valuation Report is an in-depth analysis detailing your home's value as well as a comparison with similar homes in the area
Home Values in the Area
Average Home Value in this Area
Purchase History
| Date | Buyer | Sale Price | Title Company |
|---|---|---|---|
| Langlais Robert R | -- | None Available | |
| Langlais Robert R | -- | Commonwealth | |
| Langlais Robert R | -- | North American Title Co |
Source: Public Records
Mortgage History
| Date | Status | Borrower | Loan Amount |
|---|---|---|---|
| Closed | Langlais Robert R | $195,000 | |
| Closed | Langlais Robert R | $200,000 |
Source: Public Records
Tax History Compared to Growth
Tax History
| Year | Tax Paid | Tax Assessment Tax Assessment Total Assessment is a certain percentage of the fair market value that is determined by local assessors to be the total taxable value of land and additions on the property. | Land | Improvement |
|---|---|---|---|---|
| 2025 | $4,189 | $258,833 | $93,808 | $165,025 |
| 2024 | $4,189 | $253,759 | $91,969 | $161,790 |
| 2023 | $4,178 | $248,784 | $90,166 | $158,618 |
| 2022 | $4,129 | $243,907 | $88,399 | $155,508 |
| 2021 | $4,030 | $239,125 | $86,666 | $152,459 |
| 2020 | $3,849 | $236,674 | $85,778 | $150,896 |
| 2019 | $3,781 | $232,035 | $84,097 | $147,938 |
| 2018 | $3,578 | $227,487 | $82,449 | $145,038 |
| 2017 | $3,431 | $223,028 | $80,833 | $142,195 |
| 2016 | $3,243 | $218,656 | $79,249 | $139,407 |
| 2015 | $3,168 | $215,372 | $78,059 | $137,313 |
| 2014 | $3,062 | $211,154 | $76,530 | $134,624 |
Source: Public Records
Map
Nearby Homes
- 382 Union Ave Unit C
- 521 Union Ave
- 515 Union Ave
- 866 Apricot Ave Unit C
- 185 Union Ave Unit 16
- 185 Union Ave Unit 75
- 88 La Paz Way Unit 88
- 722 Duncanville Ct
- 70 Union Place
- 701 Sweetbriar Dr
- 68 Page St
- 1959 Schrader Dr
- 665 Hawthorne Ave
- 110 S 1st St Unit 110
- 195 Sunnyside Ave
- 178 Salmar Terrace
- 912 Campisi Way Unit 115
- 912 Campisi Way Unit 201
- 186 E Rincon Ave
- 120 Kennedy Ave
- 370 Union Ave Unit D
- 370 Union Ave Unit B
- 370 Union Ave Unit A
- 372 Union Ave Unit D
- 372 Union Ave Unit C
- 372 Union Ave Unit B
- 372 Union Ave Unit A
- 382 Union Ave Unit D
- 382 Union Ave Unit D
- 382 Union Ave Unit B
- 382 Union Ave Unit A
- 100 Chalet Woods Cir
- 102 Chalet Woods Cir
- 380 Union Ave Unit A
- 380 Union Ave Unit B
- 380 Union Ave Unit C
- 380 Union Ave Unit D
- 104 Chalet Woods Cir
- 106 Chalet Woods Cir
- 384 Union Ave Unit A