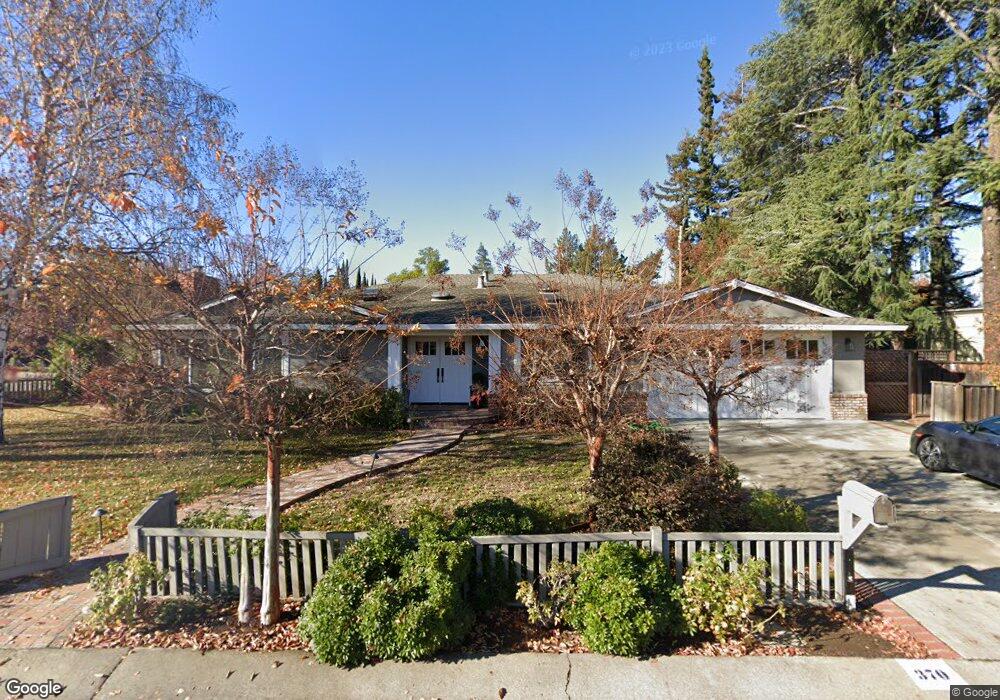
370 Valencia Dr Los Altos, CA 94022
Estimated Value: $4,522,000 - $7,298,792
4
Beds
4
Baths
2,455
Sq Ft
$2,265/Sq Ft
Est. Value
About This Home
This home is located at 370 Valencia Dr, Los Altos, CA 94022 and is currently estimated at $5,561,198, approximately $2,265 per square foot. 370 Valencia Dr is a home located in Santa Clara County with nearby schools including Almond Elementary School, Ardis G. Egan Junior High School, and Los Altos High School.
Ownership History
Date
Name
Owned For
Owner Type
Purchase Details
Closed on
May 10, 2006
Sold by
Corley Michael A and Corley Kelley M
Bought by
Corley Michael Allen and Corley Kelley Martin
Current Estimated Value
Purchase Details
Closed on
Jun 14, 2005
Sold by
Lee Kenneth K and Lee Daphne K
Bought by
Corley Michael A and Corley Kelley M
Home Financials for this Owner
Home Financials are based on the most recent Mortgage that was taken out on this home.
Original Mortgage
$900,000
Outstanding Balance
$461,966
Interest Rate
5.5%
Mortgage Type
Purchase Money Mortgage
Estimated Equity
$5,099,232
Create a Home Valuation Report for This Property
The Home Valuation Report is an in-depth analysis detailing your home's value as well as a comparison with similar homes in the area
Home Values in the Area
Average Home Value in this Area
Purchase History
| Date | Buyer | Sale Price | Title Company |
|---|---|---|---|
| Corley Michael Allen | -- | None Available | |
| Corley Michael A | $1,428,000 | Financial Title Company |
Source: Public Records
Mortgage History
| Date | Status | Borrower | Loan Amount |
|---|---|---|---|
| Open | Corley Michael A | $900,000 |
Source: Public Records
Tax History Compared to Growth
Tax History
| Year | Tax Paid | Tax Assessment Tax Assessment Total Assessment is a certain percentage of the fair market value that is determined by local assessors to be the total taxable value of land and additions on the property. | Land | Improvement |
|---|---|---|---|---|
| 2025 | $24,553 | $2,048,525 | $1,881,780 | $166,745 |
| 2024 | $24,553 | $2,008,359 | $1,844,883 | $163,476 |
| 2023 | $24,191 | $1,968,980 | $1,808,709 | $160,271 |
| 2022 | $24,008 | $1,930,374 | $1,773,245 | $157,129 |
| 2021 | $24,044 | $1,892,525 | $1,738,476 | $154,049 |
| 2020 | $24,172 | $1,873,121 | $1,720,651 | $152,470 |
| 2019 | $22,997 | $1,836,394 | $1,686,913 | $149,481 |
| 2018 | $22,450 | $1,778,387 | $1,653,837 | $124,550 |
| 2017 | $21,258 | $1,715,086 | $1,621,409 | $93,677 |
| 2016 | $20,747 | $1,681,458 | $1,589,617 | $91,841 |
| 2015 | $20,462 | $1,656,202 | $1,565,740 | $90,462 |
| 2014 | $20,500 | $1,623,760 | $1,535,070 | $88,690 |
Source: Public Records
Map
Nearby Homes
- 83 Almond Ave
- 376 Alicia Way
- 108 Coronado Ave
- 35 Alma Ct
- 589 Cherry Ave
- 704 Catalina Way
- 706 N San Antonio Rd
- 271 Stratford Place
- 141 Jordan Ave
- 1159 Solana Dr
- 805 N San Antonio Rd
- 86 3rd St Unit 203
- 226 W Edith Ave Unit 13
- 101 2nd St Unit 2
- 101 2nd St Unit 5
- 37 Los Altos Square
- 3003 Marcelli Cir
- 240 3rd St Unit 301
- 938 Clark Ave Unit 48
- 938 Clark Ave Unit 47
- 368 Fontainbleau Terrace
- 360 Fontainbleau Terrace
- 366 Fontainbleau Terrace
- 412 Valencia Dr
- 114 Jardin Dr
- 362 Fontainbleau Terrace
- 40 Parsons Way
- 364 Fontainbleau Terrace
- 413 Valencia Dr
- 361 Valencia Dr
- 350 Valencia Dr
- 418 Valencia Dr
- 75 Stuart Ct
- 30 Parsons Way
- 50 Parsons Way
- 375 N San Antonio Rd
- 124 Jardin Dr
- 351 Richelieu Ct
- 421 Valencia Dr
- 426 Valencia Dr