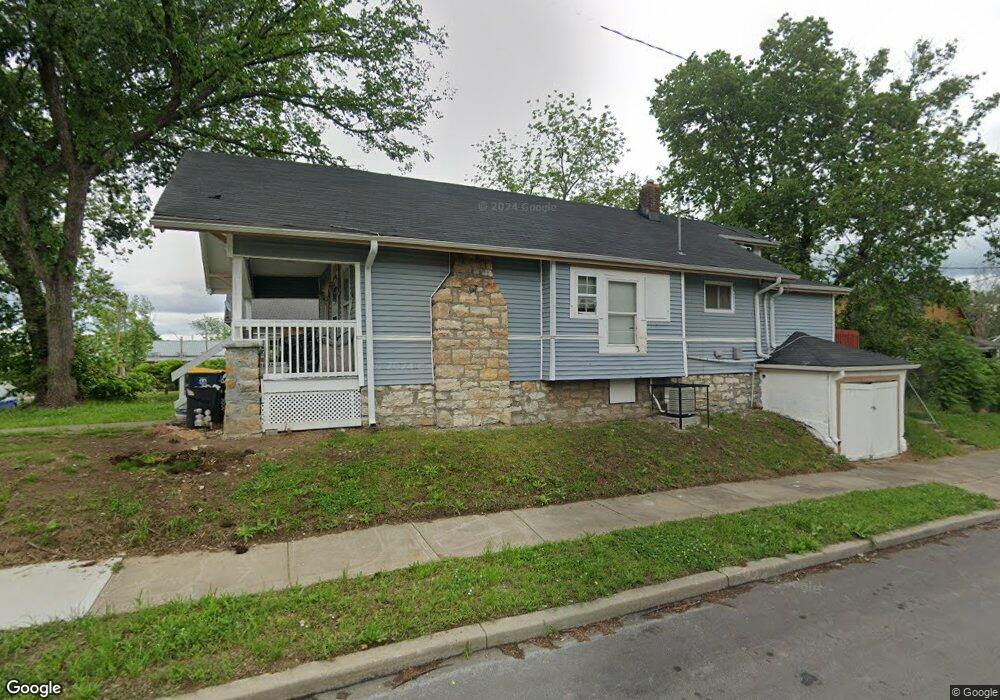
3701 E 29th St Kansas City, MO 64128
Ingleside NeighborhoodEstimated Value: $98,327 - $130,000
3
Beds
1
Bath
1,079
Sq Ft
$101/Sq Ft
Est. Value
About This Home
This home is located at 3701 E 29th St, Kansas City, MO 64128 and is currently estimated at $109,082, approximately $101 per square foot. 3701 E 29th St is a home located in Jackson County with nearby schools including George Melcher Elementary School, Central Middle School, and Central High School.
Ownership History
Date
Name
Owned For
Owner Type
Purchase Details
Closed on
Aug 31, 2023
Sold by
Mpm Energy Innovation Llc
Bought by
Mccarty Michelle A and Mccarty Paul W
Current Estimated Value
Home Financials for this Owner
Home Financials are based on the most recent Mortgage that was taken out on this home.
Original Mortgage
$76,300
Outstanding Balance
$74,626
Interest Rate
6.78%
Mortgage Type
Credit Line Revolving
Estimated Equity
$34,456
Purchase Details
Closed on
Dec 3, 2010
Sold by
Truman Road Corridor Association
Bought by
Mpm Energy Innovations Llc
Purchase Details
Closed on
Nov 4, 2010
Sold by
Flatirons Financial Inc
Bought by
Truman Road Corridor Assoc
Purchase Details
Closed on
Jul 25, 2008
Sold by
Jones Jacinta E
Bought by
Flatirons Financial Inc
Home Financials for this Owner
Home Financials are based on the most recent Mortgage that was taken out on this home.
Original Mortgage
$35,000
Interest Rate
5.98%
Mortgage Type
Future Advance Clause Open End Mortgage
Purchase Details
Closed on
May 25, 2007
Sold by
Liv Barnett Norman L
Bought by
Jones Jacinta
Create a Home Valuation Report for This Property
The Home Valuation Report is an in-depth analysis detailing your home's value as well as a comparison with similar homes in the area
Home Values in the Area
Average Home Value in this Area
Purchase History
| Date | Buyer | Sale Price | Title Company |
|---|---|---|---|
| Mccarty Michelle A | -- | None Listed On Document | |
| Mpm Energy Innovations Llc | -- | None Available | |
| Truman Road Corridor Assoc | -- | None Available | |
| Flatirons Financial Inc | -- | None Available | |
| Jones Jacinta | -- | Commonwealth Land Title Insu |
Source: Public Records
Mortgage History
| Date | Status | Borrower | Loan Amount |
|---|---|---|---|
| Open | Mccarty Michelle A | $76,300 | |
| Previous Owner | Flatirons Financial Inc | $35,000 |
Source: Public Records
Tax History Compared to Growth
Tax History
| Year | Tax Paid | Tax Assessment Tax Assessment Total Assessment is a certain percentage of the fair market value that is determined by local assessors to be the total taxable value of land and additions on the property. | Land | Improvement |
|---|---|---|---|---|
| 2025 | $432 | $4,773 | $2,736 | $2,037 |
| 2024 | $428 | $5,478 | $473 | $5,005 |
| 2023 | $428 | $5,478 | $357 | $5,121 |
| 2022 | $297 | $3,610 | $447 | $3,163 |
| 2021 | $296 | $3,610 | $447 | $3,163 |
| 2020 | $285 | $3,433 | $447 | $2,986 |
| 2019 | $279 | $3,433 | $447 | $2,986 |
| 2018 | $217 | $2,726 | $237 | $2,489 |
| 2017 | $190 | $2,726 | $237 | $2,489 |
| 2016 | $190 | $2,370 | $323 | $2,047 |
| 2014 | $190 | $2,370 | $323 | $2,047 |
Source: Public Records
Map
Nearby Homes
- 3706 E 29th St
- 2810 Cleveland Ave
- 2906 Bales Ave
- 2926 Bales Ave
- 2735 Askew Ave
- 2723 Askew Ave
- 2735 Bales Ave
- 3245 Victor St
- 3609 E 27th St
- 2936 Jackson Ave
- 3224 E 28th St
- 3012 College Ave
- 2630 Askew Ave
- 2634 Bales Ave
- 3037 Walrond Ave
- 3020 Walrond Ave
- 3207 E 27th St
- 3009 Bellefontaine Ave
- 2631 College Ave
- 4015 E Linwood Blvd
- 3703 E 29th St
- 3705 E 29th St
- 3707 E 29th St
- 3700 E 29th St
- 3702 E 29th St
- 3611 E 29th St
- 3612 E 29th St
- 3709 E 29th St
- 2911 Monroe Ave
- 2910 Monroe Ave
- 3711 E 29th St
- 3710 E 29th St
- 3610 E 29th St
- 2912 Monroe Ave
- 3715 E 29th St
- 2914 Monroe Ave
- 3607 E 29th St
- 2845 Monroe Ave
- 2919 Monroe Ave
- 3721 E 29th St