Estimated Value: $325,000 - $406,000
4
Beds
3
Baths
2,893
Sq Ft
$127/Sq Ft
Est. Value
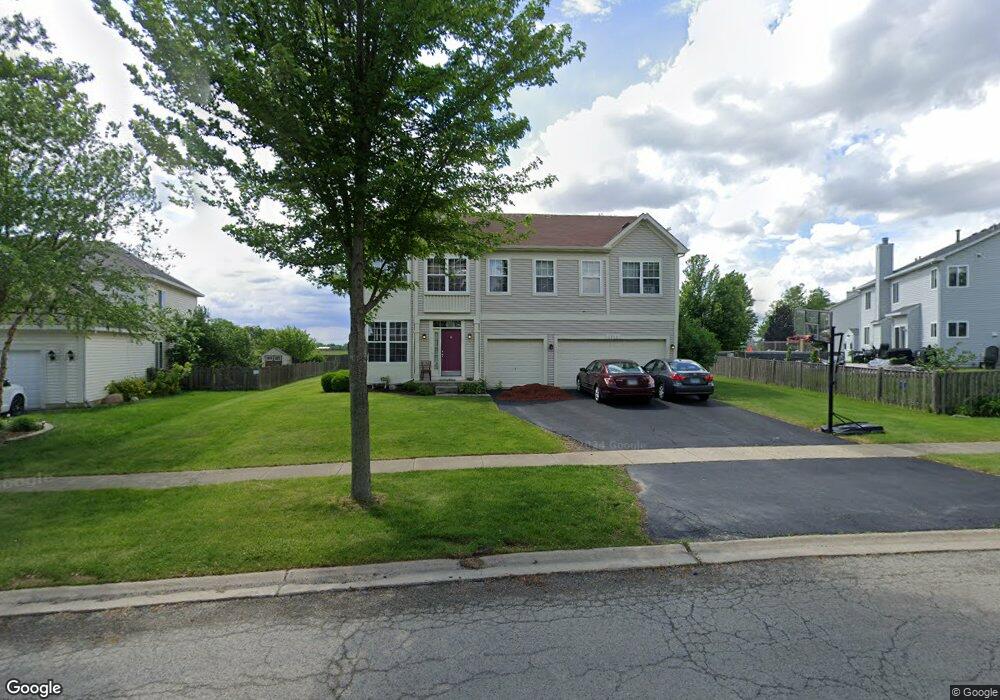
About This Home
This home is located at 3703 Bailey St, Plano, IL 60545 and is currently estimated at $368,547, approximately $127 per square foot. 3703 Bailey St is a home located in Kendall County with nearby schools including Yorkville Grade School, Yorkville Intermediate School, and Yorkville Middle School.
Ownership History
Date
Name
Owned For
Owner Type
Purchase Details
Closed on
Feb 8, 2019
Sold by
Strohl Nicole D
Bought by
Strohl Chad
Current Estimated Value
Purchase Details
Closed on
Feb 27, 2008
Sold by
Wells Fargo Bank Na
Bought by
Strohl Chad
Home Financials for this Owner
Home Financials are based on the most recent Mortgage that was taken out on this home.
Original Mortgage
$194,850
Outstanding Balance
$121,389
Interest Rate
5.74%
Mortgage Type
Seller Take Back
Estimated Equity
$247,158
Purchase Details
Closed on
Sep 25, 2007
Sold by
Wells Mary Ann
Bought by
Wells Fargo Bank Na
Purchase Details
Closed on
Feb 23, 2006
Sold by
Lakewood Springs Llc
Bought by
Wells Maryann
Home Financials for this Owner
Home Financials are based on the most recent Mortgage that was taken out on this home.
Original Mortgage
$48,719
Interest Rate
6.2%
Mortgage Type
Stand Alone Second
Create a Home Valuation Report for This Property
The Home Valuation Report is an in-depth analysis detailing your home's value as well as a comparison with similar homes in the area
Home Values in the Area
Average Home Value in this Area
Purchase History
| Date | Buyer | Sale Price | Title Company |
|---|---|---|---|
| Strohl Chad | -- | Attorney | |
| Strohl Chad | $216,500 | First American Title | |
| Wells Fargo Bank Na | -- | None Available | |
| Wells Maryann | $244,000 | None Available |
Source: Public Records
Mortgage History
| Date | Status | Borrower | Loan Amount |
|---|---|---|---|
| Open | Strohl Chad | $194,850 | |
| Previous Owner | Wells Maryann | $48,719 | |
| Previous Owner | Wells Maryann | $194,876 |
Source: Public Records
Tax History
| Year | Tax Paid | Tax Assessment Tax Assessment Total Assessment is a certain percentage of the fair market value that is determined by local assessors to be the total taxable value of land and additions on the property. | Land | Improvement |
|---|---|---|---|---|
| 2024 | $9,920 | $104,552 | $9,377 | $95,175 |
| 2023 | $9,197 | $92,993 | $8,340 | $84,653 |
| 2022 | $9,197 | $84,848 | $7,610 | $77,238 |
| 2021 | $8,765 | $79,603 | $7,140 | $72,463 |
| 2020 | $8,797 | $78,042 | $7,000 | $71,042 |
| 2019 | $8,689 | $75,686 | $6,713 | $68,973 |
| 2018 | $8,021 | $69,555 | $6,393 | $63,162 |
| 2017 | $7,814 | $63,813 | $6,393 | $57,420 |
| 2016 | $6,983 | $54,243 | $6,393 | $47,850 |
| 2015 | $6,032 | $43,530 | $5,250 | $38,280 |
| 2014 | -- | $40,776 | $5,000 | $35,776 |
| 2013 | -- | $36,487 | $7,058 | $29,429 |
Source: Public Records
Map
Nearby Homes
- 3304 Alyssa St Unit 2A
- 11948 Andrew St
- 3704 Munson St
- 3708 Munson St
- 11921 Andrew St
- 3311 Edward St
- 3919 Pratt St Unit 7262
- 4124 Dobbins St
- 308 Alyssa St
- 13090 River Rd
- 3305 Paige St Unit 2A
- 2913 Alyssa St
- 3863 Munson St Unit 7084
- Lot 11 Ashley Ln
- 4118 Klatt St Unit 3A
- 54 Willow Springs Ln
- 4407 Klatt St
- 2824 Hoffman St
- 3011 Hoffman St
- 3020 Hoffman St
- 3707 Bailey St
- 927 Christopher St
- 923 Christopher St
- 3711 Bailey St
- 3711 Bailey St
- 3706 Bailey St
- 919 Christopher St
- 3702 Bailey St
- 3710 Bailey St
- 3654 Bailey St
- 920 Christopher St
- 915 Christopher St
- 916 Christopher St
- 3650 Bailey St Unit 2B
- 911 Christopher St
- 3649 Bailey St
- 3646 Bailey St
- 903 Christopher St
- 3642 Bailey St
Your Personal Tour Guide
Ask me questions while you tour the home.