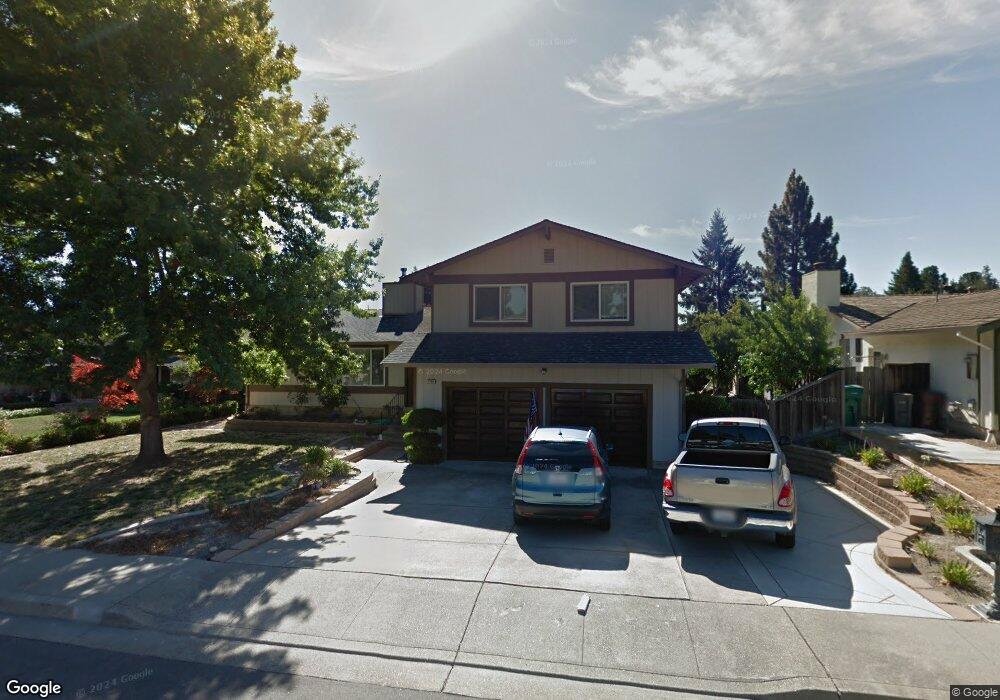
3704 Anderhan Place San Ramon, CA 94583
Twin Creeks NeighborhoodEstimated Value: $1,670,739 - $1,809,000
4
Beds
3
Baths
2,260
Sq Ft
$779/Sq Ft
Est. Value
About This Home
This home is located at 3704 Anderhan Place, San Ramon, CA 94583 and is currently estimated at $1,760,185, approximately $778 per square foot. 3704 Anderhan Place is a home located in Contra Costa County with nearby schools including Twin Creeks Elementary School, Iron Horse Middle School, and California High School.
Ownership History
Date
Name
Owned For
Owner Type
Purchase Details
Closed on
Aug 11, 2021
Sold by
Beezley Jerry E and Beezley Kathleen A
Bought by
Beezley Jerry E and Beezley Kathleen A
Current Estimated Value
Home Financials for this Owner
Home Financials are based on the most recent Mortgage that was taken out on this home.
Original Mortgage
$425,500
Interest Rate
2.9%
Mortgage Type
New Conventional
Purchase Details
Closed on
Jun 24, 2011
Sold by
Beezley Jerry E and Beezley Kathleen A
Bought by
Beezley Jerry E and Beezley Kathleen A
Home Financials for this Owner
Home Financials are based on the most recent Mortgage that was taken out on this home.
Original Mortgage
$188,524
Interest Rate
4.55%
Mortgage Type
New Conventional
Purchase Details
Closed on
Jan 10, 2008
Sold by
Beezley Jerry E and Beezley Kathleen
Bought by
Beezley Jerry E and Beezley Kathleen A
Create a Home Valuation Report for This Property
The Home Valuation Report is an in-depth analysis detailing your home's value as well as a comparison with similar homes in the area
Home Values in the Area
Average Home Value in this Area
Purchase History
| Date | Buyer | Sale Price | Title Company |
|---|---|---|---|
| Beezley Jerry E | -- | Amrock Inc | |
| Beezley Jerry E | -- | Amrock Inc | |
| Beezley Jerry E | -- | North American Title Company | |
| Beezley Jerry E | -- | North American Title Company | |
| Beezley Jerry E | -- | None Available |
Source: Public Records
Mortgage History
| Date | Status | Borrower | Loan Amount |
|---|---|---|---|
| Closed | Beezley Jerry E | $425,500 | |
| Closed | Beezley Jerry E | $188,524 |
Source: Public Records
Tax History Compared to Growth
Tax History
| Year | Tax Paid | Tax Assessment Tax Assessment Total Assessment is a certain percentage of the fair market value that is determined by local assessors to be the total taxable value of land and additions on the property. | Land | Improvement |
|---|---|---|---|---|
| 2025 | $5,114 | $390,922 | $116,207 | $274,715 |
| 2024 | $5,019 | $383,258 | $113,929 | $269,329 |
| 2023 | $5,019 | $375,745 | $111,696 | $264,049 |
| 2022 | $4,980 | $368,378 | $109,506 | $258,872 |
| 2021 | $4,865 | $361,156 | $107,359 | $253,797 |
| 2019 | $4,733 | $350,446 | $104,176 | $246,270 |
| 2018 | $4,556 | $343,576 | $102,134 | $241,442 |
| 2017 | $4,385 | $336,840 | $100,132 | $236,708 |
| 2016 | $4,310 | $330,236 | $98,169 | $232,067 |
| 2015 | $4,239 | $325,277 | $96,695 | $228,582 |
| 2014 | $4,165 | $318,906 | $94,801 | $224,105 |
Source: Public Records
Map
Nearby Homes
- 600 Guaymas Ct
- 2720 Marsh Dr
- 560 La Copita Ct
- 205 Compton Cir Unit B
- 44 Dos Rios Ct
- 412 Carillo Ct
- 2632 Campeche Ct
- 2782 Canyon Creek Dr
- 408 Fernando Ct
- 732 Fountainhead Ct
- 334 La Paz Ct
- 2809 Fountainhead Dr
- 121 Skyline Dr Unit 5
- 437 Ryan Terrace
- 2749 Fountainhead Dr
- Plan 3 at City Village - The Towns
- Plan 3 at City Village - The Rows
- Plan 1X at City Village - The Courts
- Plan 2 at City Village - The Towns
- Plan 3X at City Village - The Courts
- 3700 Anderhan Place
- 3708 Anderhan Place
- 2731 Sherbear Dr
- 3772 Norris Canyon Rd
- 3705 Anderhan Place
- 3712 Anderhan Place
- 3701 Anderhan Place
- 3776 Norris Canyon Rd
- 3714 Anderhan Place
- 2728 Sherbear Dr
- 2730 Sherbear Dr
- 3713 Anderhan Place
- 2726 Sherbear Dr
- 217 Gaucho Ct
- 213 Gaucho Ct
- 2633 Meadow Glen Place
- 3767 Norris Canyon Rd
- 3706 Bocmart Place
- 2724 Sherbear Dr
- 124 Laredo Ct