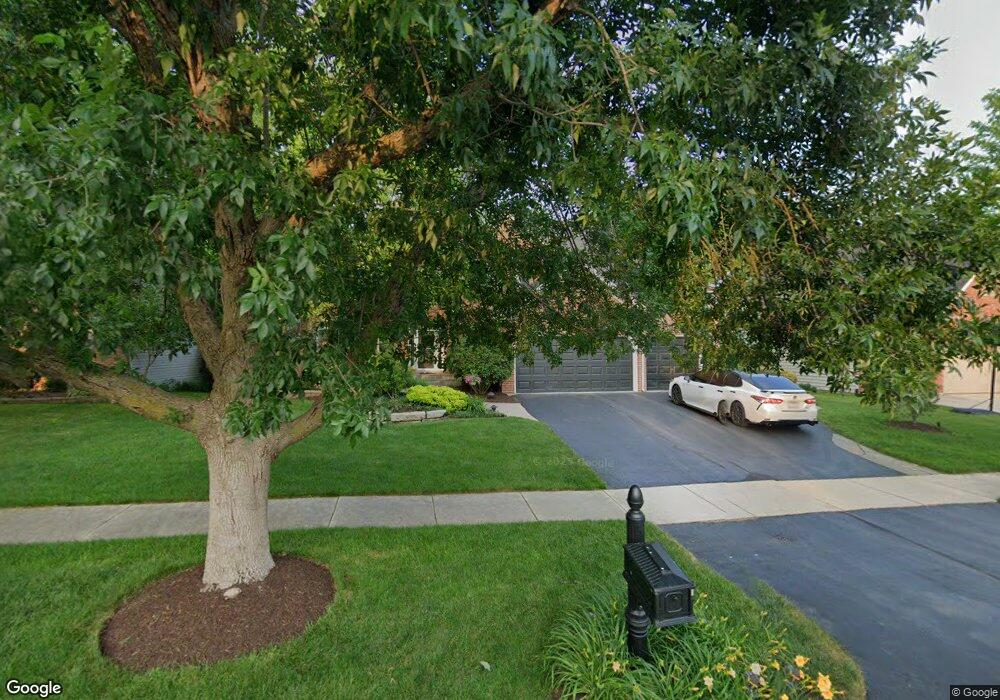
3707 Highknob Cir Unit 1 Naperville, IL 60564
Tall Grass NeighborhoodEstimated Value: $762,805 - $857,000
4
Beds
3
Baths
2,906
Sq Ft
$278/Sq Ft
Est. Value
About This Home
This home is located at 3707 Highknob Cir Unit 1, Naperville, IL 60564 and is currently estimated at $806,701, approximately $277 per square foot. 3707 Highknob Cir Unit 1 is a home located in Will County with nearby schools including Fry Elementary School, Scullen Middle School, and Waubonsie Valley High School.
Ownership History
Date
Name
Owned For
Owner Type
Purchase Details
Closed on
Jun 19, 2003
Sold by
Hernandez Michael C and Gully Kathleen
Bought by
Ratcliff Bruce A and Boyle Mary Elizabeth
Current Estimated Value
Home Financials for this Owner
Home Financials are based on the most recent Mortgage that was taken out on this home.
Original Mortgage
$355,300
Outstanding Balance
$150,887
Interest Rate
5.36%
Mortgage Type
Purchase Money Mortgage
Estimated Equity
$655,814
Purchase Details
Closed on
Nov 19, 1999
Sold by
Patterman Builders Inc
Bought by
Hernandez Michael C and Gully Kathleen
Home Financials for this Owner
Home Financials are based on the most recent Mortgage that was taken out on this home.
Original Mortgage
$250,000
Interest Rate
7.9%
Create a Home Valuation Report for This Property
The Home Valuation Report is an in-depth analysis detailing your home's value as well as a comparison with similar homes in the area
Home Values in the Area
Average Home Value in this Area
Purchase History
| Date | Buyer | Sale Price | Title Company |
|---|---|---|---|
| Ratcliff Bruce A | $476,000 | -- | |
| Hernandez Michael C | $344,000 | -- |
Source: Public Records
Mortgage History
| Date | Status | Borrower | Loan Amount |
|---|---|---|---|
| Open | Ratcliff Bruce A | $355,300 | |
| Previous Owner | Hernandez Michael C | $250,000 |
Source: Public Records
Tax History Compared to Growth
Tax History
| Year | Tax Paid | Tax Assessment Tax Assessment Total Assessment is a certain percentage of the fair market value that is determined by local assessors to be the total taxable value of land and additions on the property. | Land | Improvement |
|---|---|---|---|---|
| 2024 | $14,787 | $233,765 | $66,332 | $167,433 |
| 2023 | $14,787 | $206,506 | $58,597 | $147,909 |
| 2022 | $14,108 | $190,583 | $55,432 | $135,151 |
| 2021 | $12,784 | $181,507 | $52,792 | $128,715 |
| 2020 | $12,542 | $178,632 | $51,956 | $126,676 |
| 2019 | $12,328 | $173,598 | $50,492 | $123,106 |
| 2018 | $11,555 | $160,249 | $49,381 | $110,868 |
| 2017 | $11,379 | $156,112 | $48,106 | $108,006 |
| 2016 | $11,358 | $152,751 | $47,070 | $105,681 |
| 2015 | $11,900 | $146,876 | $45,260 | $101,616 |
| 2014 | $11,900 | $150,665 | $45,270 | $105,395 |
| 2013 | $11,900 | $150,665 | $45,270 | $105,395 |
Source: Public Records
Map
Nearby Homes
- 2905 Normandy Cir
- 2819 Normandy Cir
- 2904 Portage St
- 3408 Parliament Ln Unit 1
- 3003 Kingbird Ct Unit IV
- 3421 Goldfinch Dr
- 3349 Rosecroft Ln Unit 2
- 2628 Drexel Dr
- 3420 Sunnyside Ct
- 3423 Sunnyside Ct
- 3311 Fairmont Ave
- 3432 Redwing Dr Unit 2
- 2836 Hillcrest Cir
- 2967 Madison Dr
- 2615 Cranbrook St
- 3281 Cool Springs Ct
- 2629 Camberley Cir
- 4446 Monroe Ct
- 4449 Monroe Ct
- 4308 Fraser Cir
- 3711 Highknob Cir
- 3703 Highknob Cir
- 3711 Grassmere Rd
- 3715 Highknob Cir
- 3023 Tall Grass Dr
- 3708 Highknob Cir
- 3027 Tall Grass Dr
- 3712 Highknob Cir
- 3704 Highknob Cir
- 3019 Tall Grass Dr
- 3719 Highknob Cir
- 3716 Highknob Cir
- 3720 Grassmere Rd
- 3724 Grassmere Rd
- 3015 Tall Grass Dr
- 3716 Grassmere Rd
- 3811 Grassmere Rd
- 3720 Highknob Cir
- 3723 Highknob Cir
- 3804 Grassmere Rd Unit 1