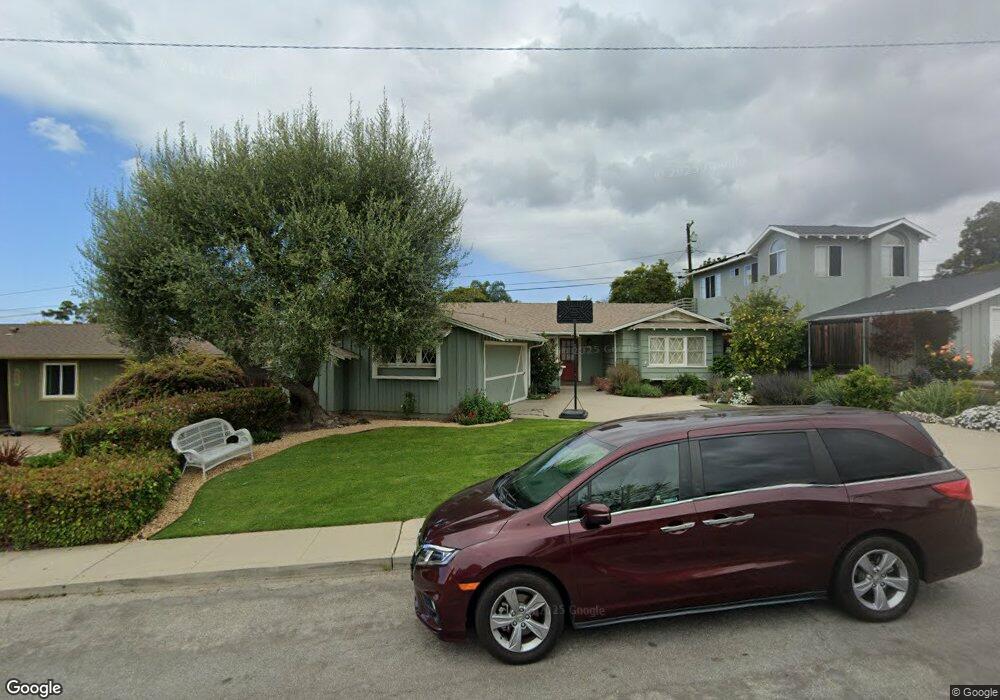
371 Appian Way Ventura, CA 93003
College NeighborhoodEstimated Value: $1,179,115 - $1,346,000
2
Beds
2
Baths
1,687
Sq Ft
$753/Sq Ft
Est. Value
About This Home
This home is located at 371 Appian Way, Ventura, CA 93003 and is currently estimated at $1,269,779, approximately $752 per square foot. 371 Appian Way is a home located in Ventura County with nearby schools including Loma Vista Elementary School, Cabrillo Middle School, and Ventura High School.
Ownership History
Date
Name
Owned For
Owner Type
Purchase Details
Closed on
Feb 12, 2015
Sold by
Cherrie Matthew Bingham and Cherrie Eva Manook
Bought by
Cherrie Matthew Bingham and Cherrie Eva Manook
Current Estimated Value
Home Financials for this Owner
Home Financials are based on the most recent Mortgage that was taken out on this home.
Original Mortgage
$447,000
Outstanding Balance
$341,100
Interest Rate
3.66%
Mortgage Type
New Conventional
Estimated Equity
$928,679
Purchase Details
Closed on
Oct 8, 2010
Sold by
Ree Edna S
Bought by
Cherrie Matthew Bingham and Cherrie Eva Manook
Home Financials for this Owner
Home Financials are based on the most recent Mortgage that was taken out on this home.
Original Mortgage
$376,000
Interest Rate
4.21%
Mortgage Type
New Conventional
Create a Home Valuation Report for This Property
The Home Valuation Report is an in-depth analysis detailing your home's value as well as a comparison with similar homes in the area
Home Values in the Area
Average Home Value in this Area
Purchase History
| Date | Buyer | Sale Price | Title Company |
|---|---|---|---|
| Cherrie Matthew Bingham | -- | Wfg National Title Ins Co | |
| Cherrie Matthew Bingham | $470,000 | Advantage Title |
Source: Public Records
Mortgage History
| Date | Status | Borrower | Loan Amount |
|---|---|---|---|
| Open | Cherrie Matthew Bingham | $447,000 | |
| Closed | Cherrie Matthew Bingham | $79,900 | |
| Previous Owner | Cherrie Matthew Bingham | $376,000 |
Source: Public Records
Tax History Compared to Growth
Tax History
| Year | Tax Paid | Tax Assessment Tax Assessment Total Assessment is a certain percentage of the fair market value that is determined by local assessors to be the total taxable value of land and additions on the property. | Land | Improvement |
|---|---|---|---|---|
| 2025 | $6,433 | $602,139 | $416,378 | $185,761 |
| 2024 | $6,433 | $590,333 | $408,214 | $182,119 |
| 2023 | $6,359 | $578,758 | $400,209 | $178,549 |
| 2022 | $5,910 | $567,410 | $392,361 | $175,049 |
| 2021 | $5,880 | $556,285 | $384,668 | $171,617 |
| 2020 | $5,827 | $550,583 | $380,725 | $169,858 |
| 2019 | $5,721 | $539,788 | $373,260 | $166,528 |
| 2018 | $5,626 | $529,205 | $365,942 | $163,263 |
| 2017 | $5,523 | $518,829 | $358,767 | $160,062 |
| 2016 | $5,427 | $508,657 | $351,733 | $156,924 |
| 2015 | $5,340 | $501,018 | $346,450 | $154,568 |
| 2014 | -- | $491,206 | $339,664 | $151,542 |
Source: Public Records
Map
Nearby Homes
- 287 Oberlin Ave
- 339 Carol Dr
- 251 Palomares Ave
- 4205 Foothill Rd
- 3750 Mound Ave
- 33 Glen Ellen Dr
- 114 San Marino Ave
- 3124 Grove St
- 3302 San Luis St
- 4797 Loma Vista Rd
- 109 S Dunning St
- 412 Dayloma Ave
- 4700 Aurora Dr Unit 16
- 4700 Aurora Dr Unit 75
- 4700 Aurora Dr Unit 29
- 3700 Dean Dr Unit 1101
- 3700 Dean Dr Unit 2106
- 3700 Dean Dr Unit 302
- 3700 Dean Dr Unit 1207
- 505 Briarwood Terrace
- 381 Appian Way
- 359 Appian Way
- 364 Dorothy Ave
- 352 Dorothy Ave
- 393 Appian Way
- 349 Appian Way
- 366 Appian Way
- 376 Appian Way
- 374 Dorothy Ave
- 344 Appian Way
- 388 Appian Way
- 401 Appian Way
- 337 Appian Way
- 386 Dorothy Ave
- 342 Dorothy Ave
- 330 Dorothy Ave
- 353 Court Ave
- 367 Court Ave
- 345 Court Ave
- 398 Appian Way