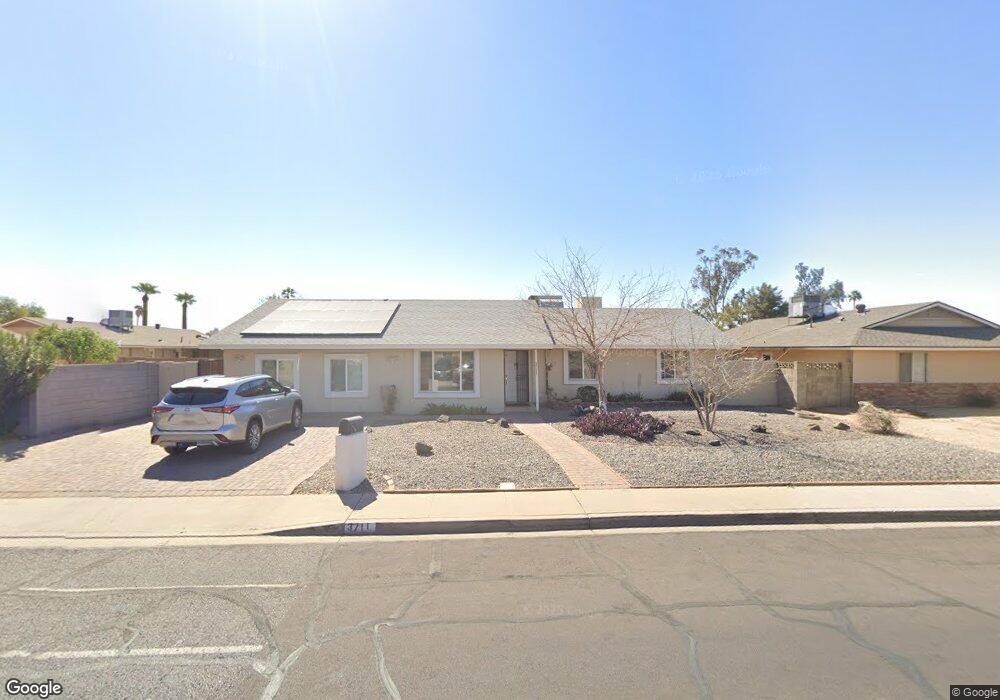
3711 W Cholla St Phoenix, AZ 85029
North Mountain Village NeighborhoodEstimated Value: $434,000 - $590,000
5
Beds
3
Baths
2,145
Sq Ft
$232/Sq Ft
Est. Value
About This Home
This home is located at 3711 W Cholla St, Phoenix, AZ 85029 and is currently estimated at $498,365, approximately $232 per square foot. 3711 W Cholla St is a home located in Maricopa County with nearby schools including Tumbleweed Elementary School, Cholla Middle School, and Moon Valley High School.
Ownership History
Date
Name
Owned For
Owner Type
Purchase Details
Closed on
Oct 4, 2021
Sold by
Bosancu Sara
Bought by
Nextgen Development Group V Llc
Current Estimated Value
Home Financials for this Owner
Home Financials are based on the most recent Mortgage that was taken out on this home.
Original Mortgage
$423,000
Outstanding Balance
$384,899
Interest Rate
2.8%
Mortgage Type
Commercial
Estimated Equity
$113,466
Purchase Details
Closed on
Mar 15, 2018
Sold by
Bot Ana
Bought by
Bosancu Sara
Purchase Details
Closed on
Dec 2, 2002
Sold by
Fields Jerry D and Fields Charleen
Bought by
Bot Ana
Home Financials for this Owner
Home Financials are based on the most recent Mortgage that was taken out on this home.
Original Mortgage
$92,800
Interest Rate
6.03%
Mortgage Type
New Conventional
Purchase Details
Closed on
Apr 15, 1996
Sold by
Brown Bryan
Bought by
Fields Jerry D and Fields Charleen
Home Financials for this Owner
Home Financials are based on the most recent Mortgage that was taken out on this home.
Original Mortgage
$25,000
Interest Rate
7.84%
Create a Home Valuation Report for This Property
The Home Valuation Report is an in-depth analysis detailing your home's value as well as a comparison with similar homes in the area
Home Values in the Area
Average Home Value in this Area
Purchase History
| Date | Buyer | Sale Price | Title Company |
|---|---|---|---|
| Nextgen Development Group V Llc | $525,000 | Commonwealth Land Ttl Ins Co | |
| Bosancu Sara | -- | None Available | |
| Bot Ana | $116,000 | Stewart Title & Trust | |
| Fields Jerry D | -- | -- |
Source: Public Records
Mortgage History
| Date | Status | Borrower | Loan Amount |
|---|---|---|---|
| Open | Nextgen Development Group V Llc | $423,000 | |
| Previous Owner | Bot Ana | $92,800 | |
| Previous Owner | Fields Jerry D | $25,000 |
Source: Public Records
Tax History
| Year | Tax Paid | Tax Assessment Tax Assessment Total Assessment is a certain percentage of the fair market value that is determined by local assessors to be the total taxable value of land and additions on the property. | Land | Improvement |
|---|---|---|---|---|
| 2025 | $1,654 | $13,019 | -- | -- |
| 2024 | $1,563 | $12,399 | -- | -- |
| 2023 | $1,563 | $29,860 | $5,970 | $23,890 |
| 2022 | $1,512 | $22,830 | $4,560 | $18,270 |
| 2021 | $1,532 | $21,250 | $4,250 | $17,000 |
| 2020 | $1,494 | $19,620 | $3,920 | $15,700 |
| 2019 | $1,466 | $17,530 | $3,500 | $14,030 |
| 2018 | $1,428 | $16,570 | $3,310 | $13,260 |
| 2017 | $1,421 | $14,380 | $2,870 | $11,510 |
| 2016 | $1,395 | $13,410 | $2,680 | $10,730 |
| 2015 | $1,292 | $13,830 | $2,760 | $11,070 |
Source: Public Records
Map
Nearby Homes
- 3654 W Shangri la Rd
- 11430 N 37th Ave
- 3824 W Shangri la Rd
- 3736 W Mercer Ln
- 3840 W Sierra St
- 11002 N 39th Ave
- 3743 W Sahuaro Dr
- 3802 W Sahuaro Dr
- 3939 W Cholla St
- 11615 N 39th Dr
- 3438 W Sierra St
- 10802 N 39th Ave
- 11417 N 33rd Ave
- 11827 N 40th Dr
- 11022 N 41st Ave
- 3937 W Paradise Dr
- 11601 N 33rd Ave
- 3251 W Cortez Ave
- 4107 W Poinsettia Dr
- 3339 W Shaw Butte Dr
- 3717 W Cholla St
- 11230 N 37th Ave
- 11226 N 37th Ave
- 11221 N 37th Dr
- 3723 W Cholla St
- 3710 W Cholla St
- 3716 W Cholla St
- 3702 W Cholla St
- 3722 W Cholla St
- 3729 W Cholla St
- 11212 N 37th Ave
- 3645 W Cholla St
- 11220 N 37th Dr
- 3728 W Cholla St
- 11215 N 37th Ave Unit 2
- 11215 N 37th Ave
- 3646 W Cholla St
- 3711 W Lupine Ave
- 3707 W Lupine Ave
- 11205 N 37th Dr
Your Personal Tour Guide
Ask me questions while you tour the home.