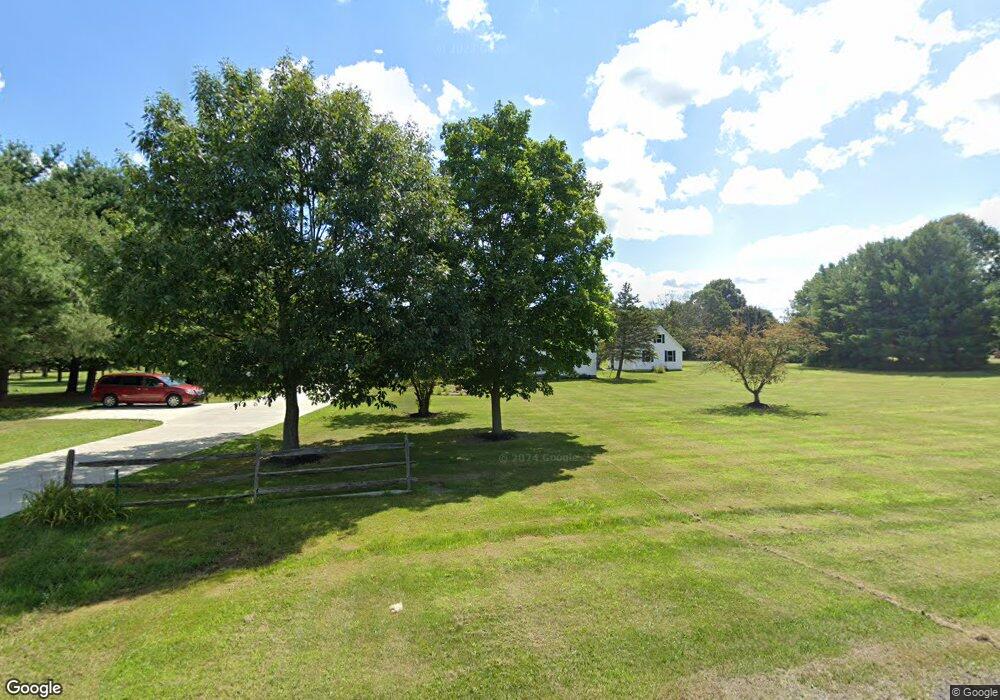
3711 W Sweet Briar Dr Medina, OH 44256
Estimated Value: $483,571 - $571,000
4
Beds
3
Baths
2,091
Sq Ft
$245/Sq Ft
Est. Value
About This Home
This home is located at 3711 W Sweet Briar Dr, Medina, OH 44256 and is currently estimated at $512,643, approximately $245 per square foot. 3711 W Sweet Briar Dr is a home located in Medina County with nearby schools including Highland Middle School and Highland High School.
Ownership History
Date
Name
Owned For
Owner Type
Purchase Details
Closed on
Sep 26, 2014
Sold by
Otto Stephen C
Bought by
Lindsey Nicolaas and Lindsey Jennifer
Current Estimated Value
Home Financials for this Owner
Home Financials are based on the most recent Mortgage that was taken out on this home.
Original Mortgage
$245,471
Outstanding Balance
$184,808
Interest Rate
3.62%
Mortgage Type
FHA
Estimated Equity
$327,835
Purchase Details
Closed on
Aug 8, 2012
Sold by
Otto Stephen C and Otto Amy M
Bought by
Otto Stephen C
Purchase Details
Closed on
Aug 7, 2012
Sold by
Otto Amy M
Bought by
Otto Stephen C
Purchase Details
Closed on
Mar 29, 1996
Sold by
Kelly Jeffrey A
Bought by
Otto Stephen C and Otto Amy M
Home Financials for this Owner
Home Financials are based on the most recent Mortgage that was taken out on this home.
Original Mortgage
$153,850
Interest Rate
6.98%
Mortgage Type
New Conventional
Create a Home Valuation Report for This Property
The Home Valuation Report is an in-depth analysis detailing your home's value as well as a comparison with similar homes in the area
Home Values in the Area
Average Home Value in this Area
Purchase History
| Date | Buyer | Sale Price | Title Company |
|---|---|---|---|
| Lindsey Nicolaas | $250,000 | Title First Agency Inc | |
| Otto Stephen C | -- | -- | |
| Otto Stephen C | -- | None Available | |
| Otto Stephen C | $181,000 | -- |
Source: Public Records
Mortgage History
| Date | Status | Borrower | Loan Amount |
|---|---|---|---|
| Open | Lindsey Nicolaas | $245,471 | |
| Previous Owner | Otto Stephen C | $153,850 |
Source: Public Records
Tax History Compared to Growth
Tax History
| Year | Tax Paid | Tax Assessment Tax Assessment Total Assessment is a certain percentage of the fair market value that is determined by local assessors to be the total taxable value of land and additions on the property. | Land | Improvement |
|---|---|---|---|---|
| 2024 | $5,090 | $127,450 | $60,130 | $67,320 |
| 2023 | $5,090 | $127,450 | $60,130 | $67,320 |
| 2022 | $4,759 | $124,870 | $60,130 | $64,740 |
| 2021 | $4,185 | $95,700 | $46,260 | $49,440 |
| 2020 | $4,356 | $95,700 | $46,260 | $49,440 |
| 2019 | $4,412 | $96,610 | $46,260 | $50,350 |
| 2018 | $4,272 | $89,480 | $40,300 | $49,180 |
| 2017 | $4,284 | $89,480 | $40,300 | $49,180 |
| 2016 | $4,056 | $89,480 | $40,300 | $49,180 |
| 2015 | $3,932 | $83,630 | $37,660 | $45,970 |
| 2014 | $3,918 | $83,630 | $37,660 | $45,970 |
| 2013 | $3,925 | $83,630 | $37,660 | $45,970 |
Source: Public Records
Map
Nearby Homes
- 1910 Wilbur Rd
- 3887 Ridge Rd
- 3933 Argyle Ln
- 2711 Mccarren Dr
- 0 Remsen Rd Unit 5162352
- 4034 Nichols Rd
- 3694 Nichols Rd
- 2929 Stony Hill Rd
- 3364 Old Weymouth Rd
- 4959 Ridge Rd
- 2641 Morning Star Dr
- 4928 Windfall Rd
- 2585 Stony Hill Rd
- 4921 Bambeck Rd
- 2803 W 130th St
- V/L Granger Rd
- 775 Lang Farm Dr
- 2827 Cynthia Dr
- 2868 Aaron Dr
- 0 Boneta Rd
- 3733 W Sweet Briar Dr
- 3702 W Sweet Briar Dr
- 1902 Wilbur Rd
- 1890 Wilbur Rd
- 3755 W Sweet Briar Dr
- 1926 Wilbur Rd
- 3728 W Sweet Briar Dr
- 1851 Wilbur Rd
- 1870 Wilbur Rd
- 3779 W Sweet Briar Dr
- 1825 Wilbur Rd
- 3959 Beach Rd
- 3762 W Sweet Briar Dr
- 3969 Beach Rd
- 23256 Wilbur Rd
- V/L 1-2 Wilbur Rd
- V/L 3 Wilbur Rd
- VL 1-2-3 Wilbur Rd
- V/L 1 Wilbur Rd
- VL 3 Wilbur Rd