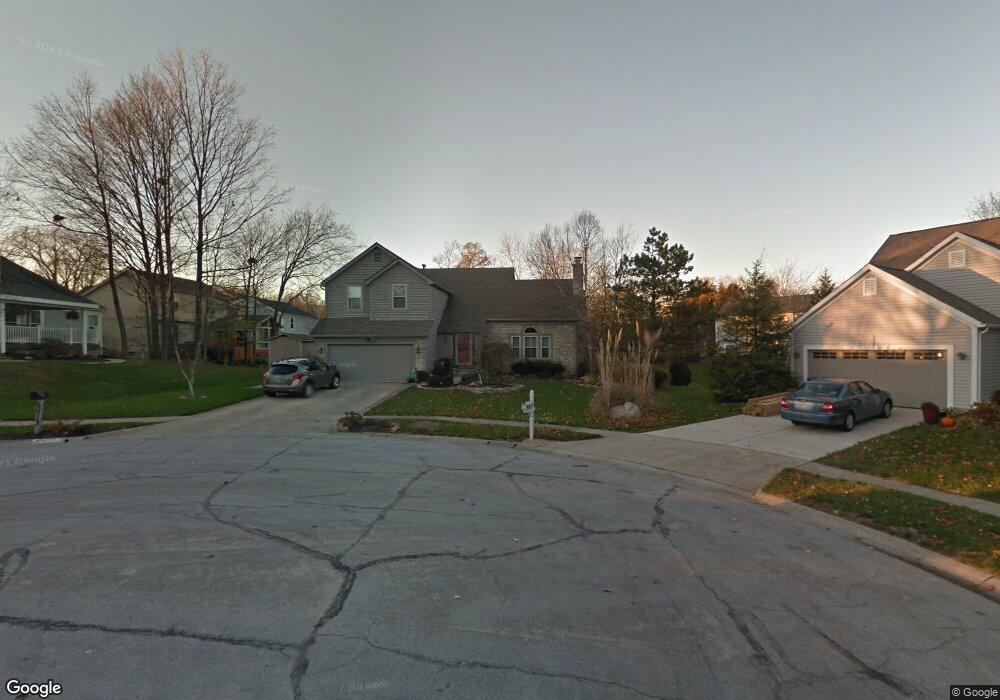
3712 Collet Ct Columbus, OH 43228
Scioto Woods NeighborhoodEstimated Value: $424,000 - $454,000
3
Beds
3
Baths
2,376
Sq Ft
$186/Sq Ft
Est. Value
About This Home
This home is located at 3712 Collet Ct, Columbus, OH 43228 and is currently estimated at $441,909, approximately $185 per square foot. 3712 Collet Ct is a home located in Franklin County with nearby schools including Galloway Ridge Intermediate School, Prairie Lincoln Elementary School, and Norton Middle School.
Ownership History
Date
Name
Owned For
Owner Type
Purchase Details
Closed on
Oct 24, 2012
Sold by
Stranges William S and Stranges Elizabeth Ann
Bought by
Stranges William S and Stranges Elizabeth Ann
Current Estimated Value
Purchase Details
Closed on
Sep 15, 2006
Sold by
Lustri Paola Galvis and Lustri Dino
Bought by
Stranges William S and Stranges Elizabeth Ann
Home Financials for this Owner
Home Financials are based on the most recent Mortgage that was taken out on this home.
Original Mortgage
$206,000
Outstanding Balance
$123,913
Interest Rate
6.7%
Mortgage Type
Purchase Money Mortgage
Estimated Equity
$317,996
Purchase Details
Closed on
Jun 12, 2000
Sold by
Chakravarti Navaneah and Chakravarti Jayashree
Bought by
Galvis Paola
Purchase Details
Closed on
May 18, 1998
Sold by
Ruh Kay M
Bought by
Chakravarti Navaneeth and Chakravarti Jayashree
Purchase Details
Closed on
Mar 15, 1994
Purchase Details
Closed on
Jan 5, 1993
Create a Home Valuation Report for This Property
The Home Valuation Report is an in-depth analysis detailing your home's value as well as a comparison with similar homes in the area
Home Values in the Area
Average Home Value in this Area
Purchase History
| Date | Buyer | Sale Price | Title Company |
|---|---|---|---|
| Stranges William S | -- | None Available | |
| Stranges William S | $206,000 | None Available | |
| Galvis Paola | $193,000 | -- | |
| Chakravarti Navaneeth | $175,500 | -- | |
| -- | $77,100 | -- | |
| -- | $154,200 | -- |
Source: Public Records
Mortgage History
| Date | Status | Borrower | Loan Amount |
|---|---|---|---|
| Open | Stranges William S | $206,000 |
Source: Public Records
Tax History Compared to Growth
Tax History
| Year | Tax Paid | Tax Assessment Tax Assessment Total Assessment is a certain percentage of the fair market value that is determined by local assessors to be the total taxable value of land and additions on the property. | Land | Improvement |
|---|---|---|---|---|
| 2024 | $4,516 | $133,670 | $38,500 | $95,170 |
| 2023 | $4,459 | $133,665 | $38,500 | $95,165 |
| 2022 | $4,484 | $100,630 | $15,330 | $85,300 |
| 2021 | $4,574 | $100,630 | $15,330 | $85,300 |
| 2020 | $4,548 | $100,630 | $15,330 | $85,300 |
| 2019 | $4,067 | $81,240 | $12,250 | $68,990 |
| 2018 | $3,940 | $81,240 | $12,250 | $68,990 |
| 2017 | $3,931 | $81,240 | $12,250 | $68,990 |
| 2016 | $3,833 | $72,100 | $15,330 | $56,770 |
| 2015 | $3,833 | $72,100 | $15,330 | $56,770 |
| 2014 | $3,836 | $72,100 | $15,330 | $56,770 |
| 2013 | $1,903 | $72,100 | $15,330 | $56,770 |
Source: Public Records
Map
Nearby Homes
- 3664 Grimes Dr
- 3495 La Coste Ln
- 3757 Gibbstone Dr
- 3761 Gibbstone Dr
- 4000 Sandy Ridge Dr
- 2051 Tuckaway Ct
- 3570 Dover Rd
- 3254 Dover Rd
- 3252 Dover Rd
- 3161 Bowdoin Cir
- 1150 Romona Place
- 0 Lowell Dr Unit 223009270
- 2350 Hetter St
- 2754 Scioto Station Dr
- 2704 Scioto Station Dr Unit 2704
- 2288 Quarry Trails Dr
- 2867 Kobuk Dr Unit 404
- 2867 Kobuk Dr Unit 304
- 2867 Kobuk Dr Unit 402
- 2867 Kobuk Dr Unit 201
- 1542 Vanelm St
- 1544 Mcspaden Ct
- 1528 Vanelm St
- 3700 Collet Ct
- 1539 Mcspaden Ct
- 1560 Vanelm St
- 1552 Mcspaden Ct
- 3701 Collet Ct
- 3717 Collet Ct
- 3725 Collet Ct
- 3709 Collet Ct
- 1547 Mcspaden Ct
- 1558 Mcspaden Ct
- 1568 Vanelm St
- 1531 Vanelm St
- 1543 Vanelm St
- 1523 Vanelm St
- 1576 Vanelm St
- 1555 Mcspaden Ct
- 1515 Vanelm St