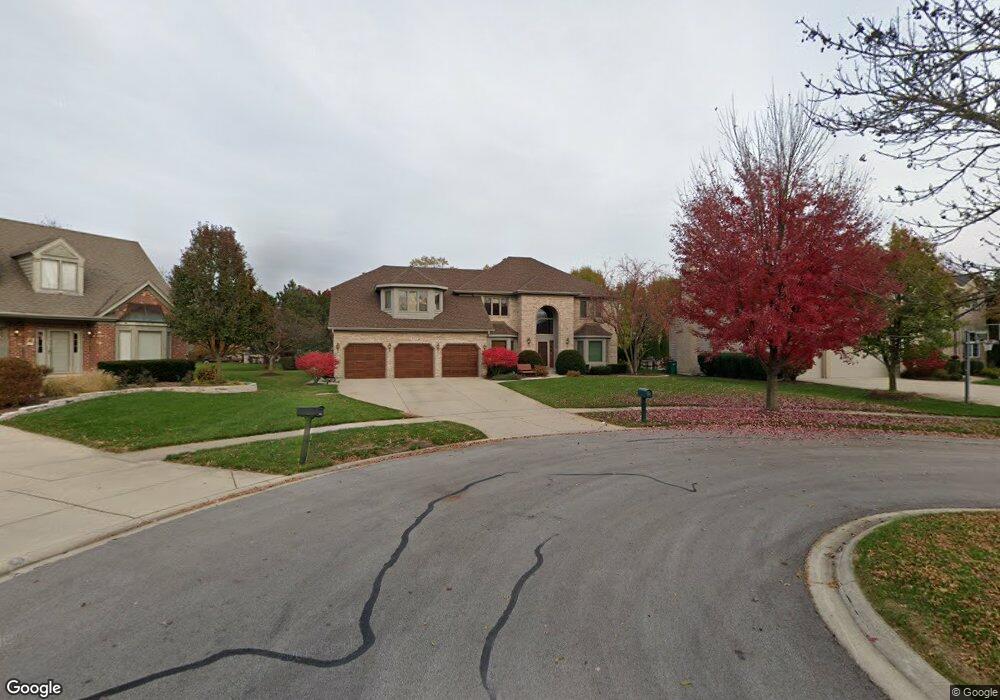
3712 De Foe Ct Naperville, IL 60564
Ashbury NeighborhoodEstimated Value: $794,885 - $887,000
--
Bed
--
Bath
3,684
Sq Ft
$228/Sq Ft
Est. Value
About This Home
This home is located at 3712 De Foe Ct, Naperville, IL 60564 and is currently estimated at $838,221, approximately $227 per square foot. 3712 De Foe Ct is a home located in Will County with nearby schools including Ellsworth Elementary School, Gordon Gregory Middle School, and Neuqua Valley High School.
Ownership History
Date
Name
Owned For
Owner Type
Purchase Details
Closed on
Feb 10, 2023
Sold by
Gargaro Robert F and Gargaro Gerilyn M
Bought by
Gargaro Living Trust and Gargaro
Current Estimated Value
Purchase Details
Closed on
Apr 29, 2021
Sold by
Gargaro Robert F and Gargaro Gerilyn M
Bought by
Garagro Living Trust and Gargaro
Purchase Details
Closed on
Jun 1, 1995
Sold by
Oak Hill Builders Inc
Bought by
Gargaro Robert F and Gargaro Gerilyn M
Home Financials for this Owner
Home Financials are based on the most recent Mortgage that was taken out on this home.
Original Mortgage
$245,000
Interest Rate
6%
Create a Home Valuation Report for This Property
The Home Valuation Report is an in-depth analysis detailing your home's value as well as a comparison with similar homes in the area
Home Values in the Area
Average Home Value in this Area
Purchase History
| Date | Buyer | Sale Price | Title Company |
|---|---|---|---|
| Gargaro Living Trust | -- | None Listed On Document | |
| Garagro Living Trust | -- | Glaser Judith | |
| Gargaro Robert F | $342,000 | -- |
Source: Public Records
Mortgage History
| Date | Status | Borrower | Loan Amount |
|---|---|---|---|
| Previous Owner | Gargaro Robert F | $245,000 |
Source: Public Records
Tax History Compared to Growth
Tax History
| Year | Tax Paid | Tax Assessment Tax Assessment Total Assessment is a certain percentage of the fair market value that is determined by local assessors to be the total taxable value of land and additions on the property. | Land | Improvement |
|---|---|---|---|---|
| 2024 | $15,103 | $238,591 | $65,131 | $173,460 |
| 2023 | $15,103 | $210,769 | $57,536 | $153,233 |
| 2022 | $13,942 | $198,432 | $54,428 | $144,004 |
| 2021 | $13,329 | $188,983 | $51,836 | $137,147 |
| 2020 | $13,076 | $185,989 | $51,015 | $134,974 |
| 2019 | $12,854 | $180,747 | $49,577 | $131,170 |
| 2018 | $12,577 | $173,891 | $48,487 | $125,404 |
| 2017 | $12,386 | $169,402 | $47,235 | $122,167 |
| 2016 | $12,364 | $165,755 | $46,218 | $119,537 |
| 2015 | $12,872 | $159,379 | $44,440 | $114,939 |
| 2014 | $12,872 | $159,912 | $44,440 | $115,472 |
| 2013 | $12,872 | $159,912 | $44,440 | $115,472 |
Source: Public Records
Map
Nearby Homes
- 3616 Eliot Ln
- 1804 Princess Cir
- 1112 Saratoga Ct
- 1736 Robert Ln
- 3816 Rosada Dr
- 3432 Caine Dr
- 2255 Wendt Cir
- 1116 Hollingswood Ave
- 3508 Tussell St
- 29W316 Andermann Dr
- 3004 Bennett Dr
- 945 Winners Cup Ct Unit 945
- 4007 Heron Ct Unit 1
- 2949 Brossman St
- 1987 Baldwin Way
- 1123 Thackery Ln
- 164 Willow Bend
- 2741 Gateshead Dr
- 2207 Sisters Ave
- 2636 Salix Cir
- 3708 De Foe Ct
- 3716 De Foe Ct Unit 8
- 3727 Mandeville Ln
- 3723 Mandeville Ln
- 3731 Mandeville Ln
- 3720 De Foe Ct
- 3704 De Foe Ct
- 3735 Mandeville Ln
- 3719 Mandeville Ln
- 3707 De Foe Ct Unit 8
- 3724 De Foe Ct
- 3711 De Foe Ct
- 1520 Branford Ln
- 3739 Mandeville Ln
- 3715 De Foe Ct
- 1524 Branford Ln
- 1508 Branford Ln
- 1528 Branford Ln
- 3719 De Foe Ct
- 1516 Branford Ln