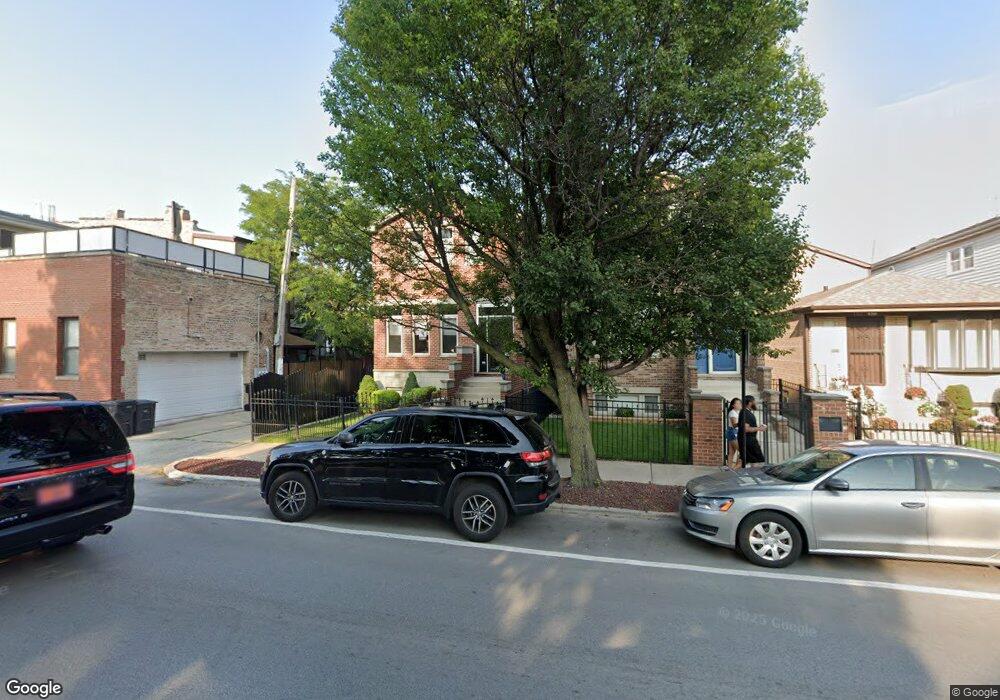
3713 S Wallace St Chicago, IL 60609
Bridgeport NeighborhoodEstimated Value: $642,903 - $806,000
4
Beds
2
Baths
1,890
Sq Ft
$389/Sq Ft
Est. Value
About This Home
This home is located at 3713 S Wallace St, Chicago, IL 60609 and is currently estimated at $735,226, approximately $389 per square foot. 3713 S Wallace St is a home located in Cook County with nearby schools including McClellan Elementary School, Bridgeport Catholic Academy - South Campus, and St Gabriel Elementary School.
Ownership History
Date
Name
Owned For
Owner Type
Purchase Details
Closed on
May 28, 2015
Sold by
Bozga John V and Bozga Andjela
Bought by
Catalano Linda A
Current Estimated Value
Home Financials for this Owner
Home Financials are based on the most recent Mortgage that was taken out on this home.
Original Mortgage
$359,200
Interest Rate
4.12%
Mortgage Type
New Conventional
Purchase Details
Closed on
Dec 9, 2008
Sold by
Bozga John V and Bozga Ana
Bought by
Bozga John V
Purchase Details
Closed on
Jul 7, 2006
Sold by
Harris Na
Bought by
Bozga John V and Bozga John
Home Financials for this Owner
Home Financials are based on the most recent Mortgage that was taken out on this home.
Original Mortgage
$400,000
Interest Rate
6.82%
Mortgage Type
Unknown
Purchase Details
Closed on
Jul 19, 2005
Sold by
Moore John P and Moore Kimberly
Bought by
Nlsb and Trust #2014
Purchase Details
Closed on
Oct 31, 2002
Sold by
Moore John P
Bought by
Moore John P
Create a Home Valuation Report for This Property
The Home Valuation Report is an in-depth analysis detailing your home's value as well as a comparison with similar homes in the area
Home Values in the Area
Average Home Value in this Area
Purchase History
| Date | Buyer | Sale Price | Title Company |
|---|---|---|---|
| Catalano Linda A | $449,000 | First American Title Ins Co | |
| Bozga John V | -- | None Available | |
| Bozga John V | $521,500 | Atg | |
| Nlsb | $415,000 | Ctic | |
| Moore John P | -- | -- |
Source: Public Records
Mortgage History
| Date | Status | Borrower | Loan Amount |
|---|---|---|---|
| Previous Owner | Catalano Linda A | $359,200 | |
| Previous Owner | Bozga John V | $400,000 |
Source: Public Records
Tax History
| Year | Tax Paid | Tax Assessment Tax Assessment Total Assessment is a certain percentage of the fair market value that is determined by local assessors to be the total taxable value of land and additions on the property. | Land | Improvement |
|---|---|---|---|---|
| 2025 | $10,083 | $64,000 | $17,020 | $46,980 |
| 2024 | $10,083 | $64,000 | $17,020 | $46,980 |
| 2023 | $10,609 | $51,106 | $13,741 | $37,365 |
| 2022 | $10,609 | $55,000 | $13,741 | $41,259 |
| 2021 | $10,390 | $54,999 | $13,741 | $41,258 |
| 2020 | $7,823 | $38,218 | $13,741 | $24,477 |
| 2019 | $7,939 | $42,942 | $13,741 | $29,201 |
| 2018 | $9,155 | $49,783 | $13,741 | $36,042 |
| 2017 | $8,075 | $40,887 | $10,930 | $29,957 |
| 2016 | $8,105 | $42,966 | $10,930 | $32,036 |
| 2015 | $7,974 | $46,138 | $10,930 | $35,208 |
| 2014 | $6,378 | $36,944 | $9,369 | $27,575 |
| 2013 | $6,241 | $36,944 | $9,369 | $27,575 |
Source: Public Records
Map
Nearby Homes
- 3727 S Lowe Ave
- 642 W 37th St
- 3640 S Lowe Ave
- 3659 S Union Ave
- 3749 S Union Ave
- 3530 S Union Ave
- 3816 S Emerald Ave
- 3600 S Halsted St
- 3422 S Normal Ave
- 3405 S Union Ave
- 835 W 35th St
- 3450 S Halsted St Unit 405
- 3450 S Halsted St Unit 409
- 3353 S Union Ave
- 934 W 35th Place
- 3453 S Lituanica Ave
- 3322 S Parnell Ave
- 3333 S Emerald Ave
- 3755 S Morgan St Unit C
- 3331 S Emerald Ave
- 3715 S Wallace St
- 3717 S Wallace St
- 3719 S Wallace St
- 557 W 37th St
- 557 W 37th St
- 553 W 37th St
- 559 W 37th St Unit 2
- 559 W 37th St
- 559 W 37th St Unit 1
- 551 W 37th St
- 3723 S Wallace St
- 549 W 37th St
- 549 W 37th St
- 547 W 37th St
- 545 W 37th St
- 3725 S Wallace St
- 3725 S Wallace St Unit 1R
- 3725 S Wallace St Unit 1F
- 3727 S Wallace St
- 3712 S Wallace St
Your Personal Tour Guide
Ask me questions while you tour the home.