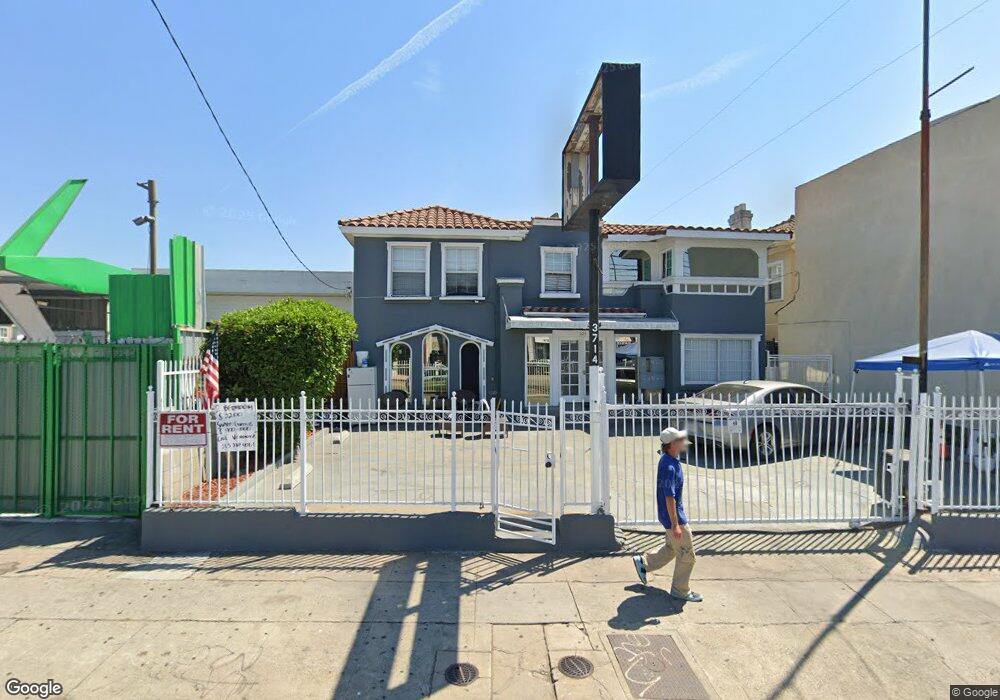
3714 W Pico Blvd Los Angeles (), LA 90019
Arlington Heights NeighborhoodEstimated Value: $2,473,950
17
Beds
11
Baths
5,854
Sq Ft
$423/Sq Ft
Est. Value
About This Home
This home is located at 3714 W Pico Blvd, Los Angeles (), LA 90019 and is currently estimated at $2,473,950, approximately $422 per square foot. 3714 W Pico Blvd is a home located in Los Angeles County with nearby schools including Carson-Gore Academy Of Enviornmental Studies, Pio Pico Middle School, and Los Angeles Senior High School.
Ownership History
Date
Name
Owned For
Owner Type
Purchase Details
Closed on
Apr 25, 2017
Sold by
Kim Myung Hi and The Myung Hi Kim 2008 Revocabl
Bought by
House Up Inc
Current Estimated Value
Purchase Details
Closed on
Nov 30, 2016
Sold by
Lee Cathie Yeong and Kim Debi Damee
Bought by
Kim Myung Hi and The Myung Hi Kim 2008 Revocabl
Home Financials for this Owner
Home Financials are based on the most recent Mortgage that was taken out on this home.
Original Mortgage
$850,000
Interest Rate
4.32%
Mortgage Type
Commercial
Purchase Details
Closed on
Nov 21, 2007
Sold by
Si Development Inc
Bought by
Lee Cathie Yeong and Kim Debi Damee
Home Financials for this Owner
Home Financials are based on the most recent Mortgage that was taken out on this home.
Original Mortgage
$897,000
Interest Rate
6.3%
Mortgage Type
Commercial
Purchase Details
Closed on
Nov 13, 2007
Sold by
Kim Steven Sung Wook
Bought by
Kim Debi Damee
Home Financials for this Owner
Home Financials are based on the most recent Mortgage that was taken out on this home.
Original Mortgage
$897,000
Interest Rate
6.3%
Mortgage Type
Commercial
Purchase Details
Closed on
May 29, 2007
Sold by
Si Development Inc
Bought by
Kim Seong Wook
Home Financials for this Owner
Home Financials are based on the most recent Mortgage that was taken out on this home.
Original Mortgage
$165,000
Interest Rate
6.14%
Mortgage Type
Credit Line Revolving
Purchase Details
Closed on
Mar 4, 2003
Sold by
Song Im Sup
Bought by
Song Yoon Hee
Home Financials for this Owner
Home Financials are based on the most recent Mortgage that was taken out on this home.
Original Mortgage
$530,000
Interest Rate
5.83%
Mortgage Type
Commercial
Purchase Details
Closed on
Jul 30, 2002
Sold by
Song Im Sup
Bought by
Sup Song Yoon Hee and Sup Song Im
Purchase Details
Closed on
Jul 20, 2000
Sold by
Kwak Jin H and Kwak Hei Y
Bought by
Song Im Sup
Create a Home Valuation Report for This Property
The Home Valuation Report is an in-depth analysis detailing your home's value as well as a comparison with similar homes in the area
Home Values in the Area
Average Home Value in this Area
Purchase History
| Date | Buyer | Sale Price | Title Company |
|---|---|---|---|
| House Up Inc | -- | None Available | |
| Kim Myung Hi | $1,690,000 | None Available | |
| Lee Cathie Yeong | $1,380,000 | Fatcola | |
| Kim Debi Damee | -- | None Available | |
| Lee Cathie Yeong | -- | None Available | |
| Si Development Inc | -- | None Available | |
| Kim Seong Wook | $1,100,000 | Fatcola | |
| Si Development Inc | -- | First American Title Co La | |
| Kim Seong Wook | -- | First American Title Co La | |
| Song Yoon Hee | -- | Stewart Title | |
| Sup Song Yoon Hee | -- | Chicago Title | |
| Song Im Sup | -- | -- |
Source: Public Records
Mortgage History
| Date | Status | Borrower | Loan Amount |
|---|---|---|---|
| Previous Owner | Kim Myung Hi | $850,000 | |
| Previous Owner | Lee Cathie Yeong | $897,000 | |
| Previous Owner | Si Development Inc | $165,000 | |
| Previous Owner | Kim Seong Wook | $825,000 | |
| Previous Owner | Song Yoon Hee | $530,000 | |
| Closed | Song Yoon Hee | $50,000 |
Source: Public Records
Tax History Compared to Growth
Tax History
| Year | Tax Paid | Tax Assessment Tax Assessment Total Assessment is a certain percentage of the fair market value that is determined by local assessors to be the total taxable value of land and additions on the property. | Land | Improvement |
|---|---|---|---|---|
| 2025 | $23,989 | $1,961,386 | $1,508,759 | $452,627 |
| 2024 | $23,989 | $1,922,928 | $1,479,176 | $443,752 |
| 2023 | $23,535 | $1,885,224 | $1,450,173 | $435,051 |
| 2022 | $22,460 | $1,848,260 | $1,421,739 | $426,521 |
| 2021 | $22,165 | $1,812,020 | $1,393,862 | $418,158 |
| 2019 | $21,511 | $1,758,276 | $1,352,520 | $405,756 |
| 2018 | $21,263 | $1,723,800 | $1,326,000 | $397,800 |
| 2016 | $18,808 | $1,531,219 | $998,622 | $532,597 |
| 2015 | $18,537 | $1,508,219 | $983,622 | $524,597 |
| 2014 | $15,215 | $1,200,000 | $800,000 | $400,000 |
Source: Public Records
Map
Nearby Homes
- 3714 W Pico Blvd
- 3425 W 15th St
- 1250 5th Ave
- 1406 3rd Ave
- 1417 S Norton Ave
- 1248 S Bronson Ave
- 1215 5th Ave
- 1406 2nd Ave
- 1235 3rd Ave
- 1437 12th Ave
- 1522 2nd Ave
- 1438 S Bronson Ave
- 1320 Crenshaw Blvd
- 1206 3rd Ave
- 1504 S Bronson Ave
- 1643 4th Ave
- 1121 5th Ave
- 1654 5th Ave
- 1125 3rd Ave
- 1187 Crenshaw Blvd Unit 1-8