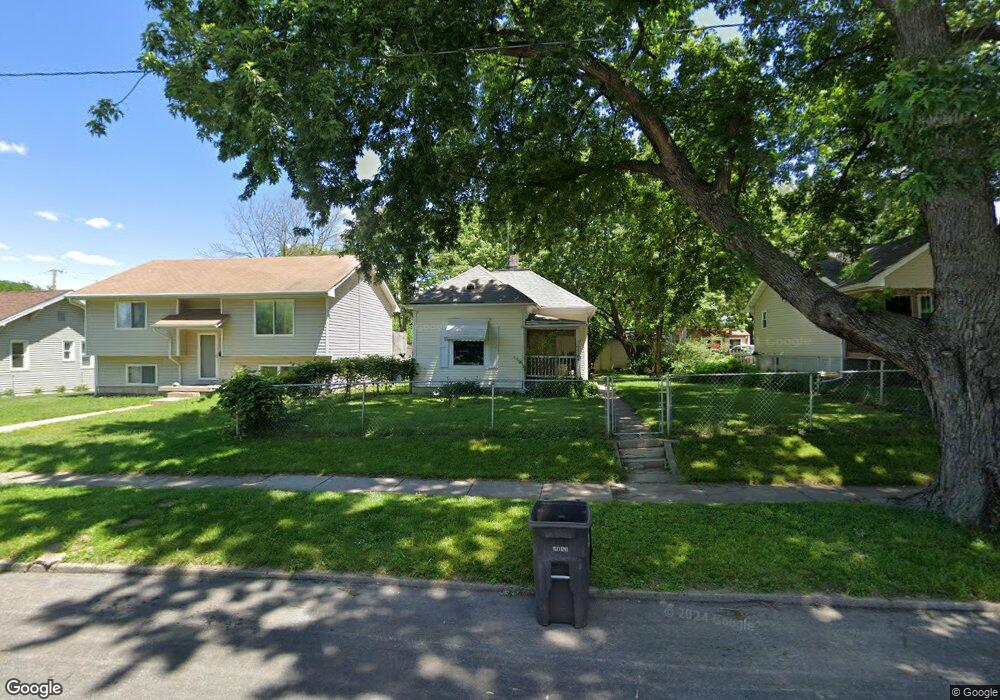
3715 4th St Des Moines, IA 50313
Highland Park NeighborhoodEstimated Value: $120,000 - $143,000
2
Beds
1
Bath
744
Sq Ft
$184/Sq Ft
Est. Value
About This Home
This home is located at 3715 4th St, Des Moines, IA 50313 and is currently estimated at $137,187, approximately $184 per square foot. 3715 4th St is a home located in Polk County with nearby schools including Oak Park Elementary School, Harding Middle School, and North High School.
Ownership History
Date
Name
Owned For
Owner Type
Purchase Details
Closed on
Oct 16, 2024
Sold by
Bohmke David
Bought by
David Bohmke Revocable Trust and Bohmke
Current Estimated Value
Purchase Details
Closed on
Aug 30, 1999
Sold by
Bohmke David
Bought by
Bohmke David and Bohmke Michelle
Purchase Details
Closed on
Jul 1, 1998
Sold by
Noah And Associates Inc
Bought by
Bohmke David
Home Financials for this Owner
Home Financials are based on the most recent Mortgage that was taken out on this home.
Original Mortgage
$51,600
Interest Rate
7.15%
Purchase Details
Closed on
Jan 29, 1998
Sold by
Firstar Bank Iowa N A
Bought by
Noah And Associates Inc
Create a Home Valuation Report for This Property
The Home Valuation Report is an in-depth analysis detailing your home's value as well as a comparison with similar homes in the area
Home Values in the Area
Average Home Value in this Area
Purchase History
| Date | Buyer | Sale Price | Title Company |
|---|---|---|---|
| David Bohmke Revocable Trust | -- | None Listed On Document | |
| David Bohmke Revocable Trust | -- | None Listed On Document | |
| Bohmke David | -- | -- | |
| Bohmke David | $64,000 | -- | |
| Noah And Associates Inc | $26,500 | -- |
Source: Public Records
Mortgage History
| Date | Status | Borrower | Loan Amount |
|---|---|---|---|
| Previous Owner | Bohmke David | $51,600 | |
| Closed | Bohmke David | $12,900 |
Source: Public Records
Tax History Compared to Growth
Tax History
| Year | Tax Paid | Tax Assessment Tax Assessment Total Assessment is a certain percentage of the fair market value that is determined by local assessors to be the total taxable value of land and additions on the property. | Land | Improvement |
|---|---|---|---|---|
| 2025 | $2,038 | $139,600 | $28,900 | $110,700 |
| 2024 | $2,038 | $121,100 | $25,100 | $96,000 |
| 2023 | $2,112 | $121,100 | $25,100 | $96,000 |
| 2022 | $2,094 | $98,500 | $21,200 | $77,300 |
| 2021 | $1,962 | $98,500 | $21,200 | $77,300 |
| 2020 | $2,032 | $87,200 | $19,000 | $68,200 |
| 2019 | $1,938 | $87,200 | $19,000 | $68,200 |
| 2018 | $1,912 | $80,600 | $17,300 | $63,300 |
| 2017 | $1,734 | $80,600 | $17,300 | $63,300 |
| 2016 | $1,684 | $72,600 | $15,500 | $57,100 |
| 2015 | $1,684 | $72,600 | $15,500 | $57,100 |
| 2014 | $1,706 | $72,900 | $15,400 | $57,500 |
Source: Public Records
Map
Nearby Homes