Estimated Value: $388,493 - $431,000
3
Beds
2
Baths
1,566
Sq Ft
$263/Sq Ft
Est. Value
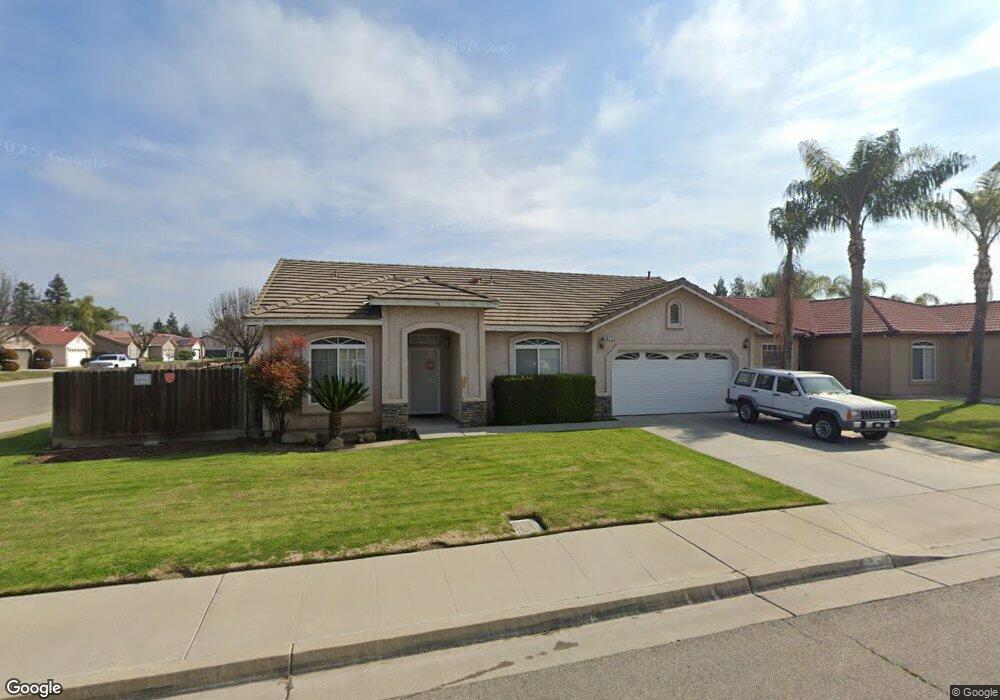
About This Home
This home is located at 3716 Bryan St, Selma, CA 93662 and is currently estimated at $411,831, approximately $262 per square foot. 3716 Bryan St is a home located in Fresno County with nearby schools including Andrew Jackson Elementary School, Abraham Lincoln Middle School, and Selma High School.
Ownership History
Date
Name
Owned For
Owner Type
Purchase Details
Closed on
Nov 7, 2011
Sold by
Majers Phyllis L
Bought by
Poblete Marco Antonio Olea and Reyes Christina N
Current Estimated Value
Home Financials for this Owner
Home Financials are based on the most recent Mortgage that was taken out on this home.
Original Mortgage
$141,324
Outstanding Balance
$95,104
Interest Rate
3.75%
Mortgage Type
FHA
Estimated Equity
$316,727
Purchase Details
Closed on
Jul 29, 2009
Sold by
Majers Olen and Majers Phyllis
Bought by
Majers Olen M and Majers Phyllis L
Purchase Details
Closed on
Apr 26, 2000
Sold by
Weingart Ronald C and Weingart Sherri
Bought by
Majers Olen and Majers Phyllis
Home Financials for this Owner
Home Financials are based on the most recent Mortgage that was taken out on this home.
Original Mortgage
$141,552
Interest Rate
8.12%
Mortgage Type
FHA
Create a Home Valuation Report for This Property
The Home Valuation Report is an in-depth analysis detailing your home's value as well as a comparison with similar homes in the area
Home Values in the Area
Average Home Value in this Area
Purchase History
| Date | Buyer | Sale Price | Title Company |
|---|---|---|---|
| Poblete Marco Antonio Olea | $145,000 | Chicago Title Company | |
| Majers Olen M | -- | None Available | |
| Majers Olen | $142,500 | Chicago Title Co |
Source: Public Records
Mortgage History
| Date | Status | Borrower | Loan Amount |
|---|---|---|---|
| Open | Poblete Marco Antonio Olea | $141,324 | |
| Previous Owner | Majers Olen | $141,552 | |
| Closed | Majers Olen | $4,275 |
Source: Public Records
Tax History
| Year | Tax Paid | Tax Assessment Tax Assessment Total Assessment is a certain percentage of the fair market value that is determined by local assessors to be the total taxable value of land and additions on the property. | Land | Improvement |
|---|---|---|---|---|
| 2025 | $3,233 | $182,114 | $54,633 | $127,481 |
| 2023 | $2,686 | $175,044 | $52,512 | $122,532 |
| 2022 | $2,971 | $171,613 | $51,483 | $120,130 |
| 2021 | $2,901 | $168,249 | $50,474 | $117,775 |
| 2020 | $2,870 | $166,525 | $49,957 | $116,568 |
| 2019 | $2,842 | $163,261 | $48,978 | $114,283 |
| 2018 | $2,778 | $160,061 | $48,018 | $112,043 |
| 2017 | $2,688 | $156,924 | $47,077 | $109,847 |
| 2016 | $2,430 | $153,848 | $46,154 | $107,694 |
| 2015 | $2,465 | $151,538 | $45,461 | $106,077 |
| 2014 | $2,403 | $148,571 | $44,571 | $104,000 |
Source: Public Records
Map
Nearby Homes
- 3767 Thompson Ave
- 2705 Hicks St
- 2606 Hillcrest St
- 3654 Thompson Ave
- 2580 Jackson St
- 3462 Shaft St
- 2222 Barbara St
- 3239 Lee St
- 3280 Mccall Ave
- 8623 E Dinuba Ave
- 1701 Dinuba Ave Unit 110
- 1701 Dinuba Ave Unit 216
- 2020 Aspen St
- 2221 Floral Ave
- 1607 Cooper St
- 2753 Thompson Ave
- 1405 Huntsman Ave
- 2510 Whitson St
- 3817 Dockery Ave
- 2561 Stillman St Unit 111
- 3710 Bryan St
- 3715 Jasper St
- 3709 Jasper St
- 3704 Bryan St
- 3711 Bryan St
- 2606 Goldridge St
- 3717 Bryan St
- 3703 Jasper St
- 2550 Goldridge St
- 3723 Bryan St
- 3651 Bryan St
- 2544 Goldridge St
- 2610 Northhill St
- 2604 Northhill St
- 3712 Snyder St
- 3702 Jasper St
- 3718 Snyder St
- 2613 Hicks St
- 2607 Hicks St
- 3706 Snyder St
Your Personal Tour Guide
Ask me questions while you tour the home.