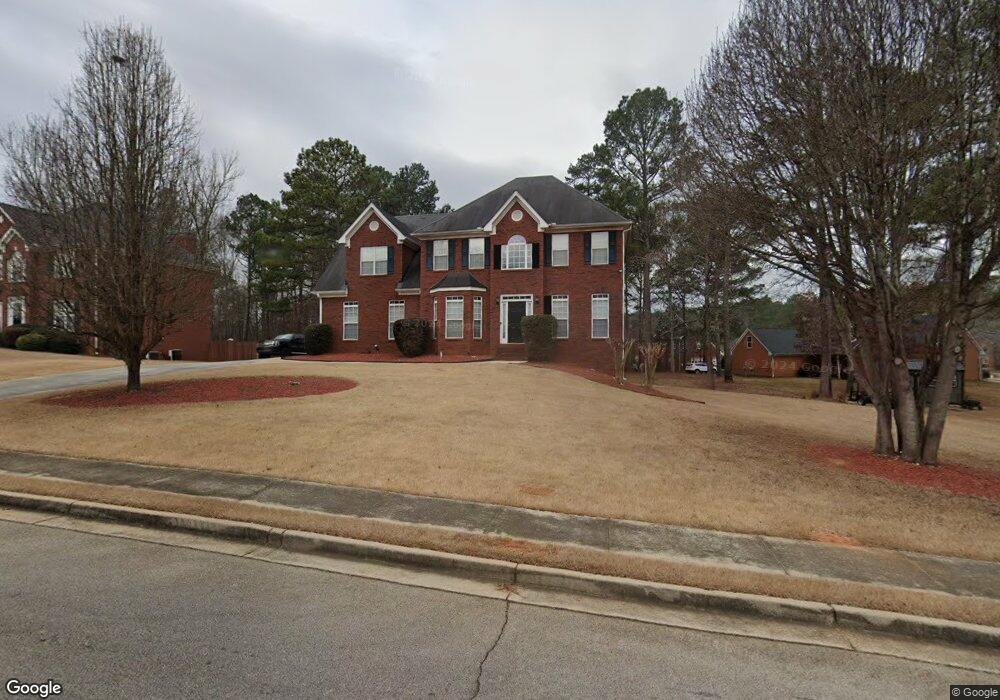
3717 Weeping Way Stockbridge, GA 30281
Estimated Value: $419,679 - $531,000
4
Beds
3
Baths
3,054
Sq Ft
$158/Sq Ft
Est. Value
About This Home
This home is located at 3717 Weeping Way, Stockbridge, GA 30281 and is currently estimated at $483,170, approximately $158 per square foot. 3717 Weeping Way is a home located in Rockdale County with nearby schools including Lorraine Elementary School, Gen. Ray Davis Middle School, and Heritage High School.
Ownership History
Date
Name
Owned For
Owner Type
Purchase Details
Closed on
Apr 13, 2009
Sold by
Wells Fargo Bank Na
Bought by
Mathis Benjik and Nabors Undrea
Current Estimated Value
Home Financials for this Owner
Home Financials are based on the most recent Mortgage that was taken out on this home.
Original Mortgage
$191,468
Outstanding Balance
$120,060
Interest Rate
4.79%
Mortgage Type
FHA
Estimated Equity
$363,110
Purchase Details
Closed on
Dec 17, 2004
Sold by
Robinson Gloria
Bought by
Wells Fargo Bank Na
Home Financials for this Owner
Home Financials are based on the most recent Mortgage that was taken out on this home.
Original Mortgage
$45,347
Interest Rate
5.66%
Mortgage Type
Stand Alone Second
Purchase Details
Closed on
Dec 17, 2002
Sold by
Srb Builders
Bought by
Robinson Gloria
Home Financials for this Owner
Home Financials are based on the most recent Mortgage that was taken out on this home.
Original Mortgage
$215,900
Interest Rate
6.1%
Mortgage Type
New Conventional
Create a Home Valuation Report for This Property
The Home Valuation Report is an in-depth analysis detailing your home's value as well as a comparison with similar homes in the area
Home Values in the Area
Average Home Value in this Area
Purchase History
| Date | Buyer | Sale Price | Title Company |
|---|---|---|---|
| Mathis Benjik | $195,000 | -- | |
| Wells Fargo Bank Na | $51,769 | -- | |
| Robinson Gloria | $239,900 | -- |
Source: Public Records
Mortgage History
| Date | Status | Borrower | Loan Amount |
|---|---|---|---|
| Open | Mathis Benjik | $191,468 | |
| Previous Owner | Wells Fargo Bank Na | $45,347 | |
| Previous Owner | Robinson Gloria | $215,900 |
Source: Public Records
Tax History Compared to Growth
Tax History
| Year | Tax Paid | Tax Assessment Tax Assessment Total Assessment is a certain percentage of the fair market value that is determined by local assessors to be the total taxable value of land and additions on the property. | Land | Improvement |
|---|---|---|---|---|
| 2024 | $4,673 | $184,560 | $35,320 | $149,240 |
| 2023 | $3,558 | $147,120 | $51,400 | $95,720 |
| 2022 | $2,536 | $107,320 | $23,480 | $83,840 |
| 2021 | $2,713 | $107,320 | $23,480 | $83,840 |
| 2020 | $2,822 | $107,320 | $23,480 | $83,840 |
| 2019 | $2,638 | $99,080 | $15,240 | $83,840 |
| 2018 | $2,699 | $100,520 | $17,640 | $82,880 |
| 2017 | $2,330 | $87,600 | $12,440 | $75,160 |
| 2016 | $2,154 | $87,600 | $12,440 | $75,160 |
| 2015 | $2,158 | $87,600 | $12,440 | $75,160 |
| 2014 | $1,931 | $87,600 | $12,440 | $75,160 |
| 2013 | -- | $101,680 | $20,000 | $81,680 |
Source: Public Records
Map
Nearby Homes
- 4009 Georgia 138
- 2700 Morgan Ct
- 4103 Sierra Ct
- 2641 Morgan Park Dr
- 3206 E Fairview Rd SW
- 3183 Jackson Creek Dr
- 2425 Wild Oak Ct
- 3180 Jackson Creek Dr
- 4012 Union Church Rd SW
- 3735 Millstream Ln
- 2400 Wild Oak Ct Unit 76
- 3444 E Fairview Rd SW
- 2170 Autumn Chase Dr
- 3310 & 3308 Bold Spring Dr
- 3310 Bold Spring Dr
- 3580 Limberlost Trail SW
- 4454 Foxfire Crossing
- 3488 Pebble Brook Ln
- 3600 Union Church Rd SW
- 3405 Monica Ln SW Unit 4
- 3721 Weeping Way
- 3807 Willow Bend Dr
- 3713 Weeping Way
- 3813 Willow Bend Dr
- 3725 Weeping Way
- 3722 Weeping Way
- 3819 Willow Bend Dr
- 3718 Weeping Way
- 3726 Weeping Way
- 3729 Weeping Way SW
- 3729 Weeping Way
- 3714 Weeping Way
- 3730 Weeping Way
- 3710 Weeping Way
- 3818 Willow Bend Dr SW
- 3808 Willow Bend Dr
- 3800 Willow Bend Dr
- 3804 Willow Bend Dr
- 3812 Willow Bend Dr
- 3825 Willow Bend Dr