372 Capistrano Ct Camarillo, CA 93010
Estimated Value: $648,641 - $687,000
3
Beds
2
Baths
1,244
Sq Ft
$538/Sq Ft
Est. Value
About This Home
This home is located at 372 Capistrano Ct, Camarillo, CA 93010 and is currently estimated at $669,660, approximately $538 per square foot. 372 Capistrano Ct is a home located in Ventura County with nearby schools including Dos Caminos Elementary School, Monte Vista Middle School, and Adolfo Camarillo High School.
Ownership History
Date
Name
Owned For
Owner Type
Purchase Details
Closed on
Apr 13, 2011
Sold by
Johnson Marvin C and Johnson Gayle L
Bought by
Getman Damon and Camarillo Leslie
Current Estimated Value
Home Financials for this Owner
Home Financials are based on the most recent Mortgage that was taken out on this home.
Original Mortgage
$190,000
Outstanding Balance
$131,328
Interest Rate
4.84%
Mortgage Type
New Conventional
Estimated Equity
$538,332
Purchase Details
Closed on
Jan 4, 2005
Sold by
Johnson Marvin Cyrus and Johnson Gayle Lorraine
Bought by
Johnson Marvin C and Johnson Gayle L
Purchase Details
Closed on
Mar 31, 1998
Sold by
Moulopoulos Spyridon D
Bought by
Johnson Marvin Cyrus and Johnson Gayle Lorraine
Home Financials for this Owner
Home Financials are based on the most recent Mortgage that was taken out on this home.
Original Mortgage
$119,000
Interest Rate
7.13%
Create a Home Valuation Report for This Property
The Home Valuation Report is an in-depth analysis detailing your home's value as well as a comparison with similar homes in the area
Home Values in the Area
Average Home Value in this Area
Purchase History
| Date | Buyer | Sale Price | Title Company |
|---|---|---|---|
| Getman Damon | $310,000 | Lawyers Title Company | |
| Johnson Marvin C | -- | -- | |
| Johnson Marvin Cyrus | $170,000 | Lawyers Title Company |
Source: Public Records
Mortgage History
| Date | Status | Borrower | Loan Amount |
|---|---|---|---|
| Open | Getman Damon | $190,000 | |
| Previous Owner | Johnson Marvin Cyrus | $119,000 |
Source: Public Records
Tax History
| Year | Tax Paid | Tax Assessment Tax Assessment Total Assessment is a certain percentage of the fair market value that is determined by local assessors to be the total taxable value of land and additions on the property. | Land | Improvement |
|---|---|---|---|---|
| 2025 | $4,376 | $397,151 | $198,576 | $198,575 |
| 2024 | $4,376 | $389,364 | $194,682 | $194,682 |
| 2023 | $4,220 | $381,730 | $190,865 | $190,865 |
| 2022 | $4,207 | $374,246 | $187,123 | $187,123 |
| 2021 | $4,057 | $366,908 | $183,454 | $183,454 |
| 2020 | $4,042 | $363,148 | $181,574 | $181,574 |
| 2019 | $4,024 | $356,028 | $178,014 | $178,014 |
| 2018 | $3,950 | $349,048 | $174,524 | $174,524 |
| 2017 | $3,718 | $342,204 | $171,102 | $171,102 |
| 2016 | $3,630 | $335,496 | $167,748 | $167,748 |
| 2015 | $3,592 | $330,458 | $165,229 | $165,229 |
| 2014 | $3,508 | $323,988 | $161,994 | $161,994 |
Source: Public Records
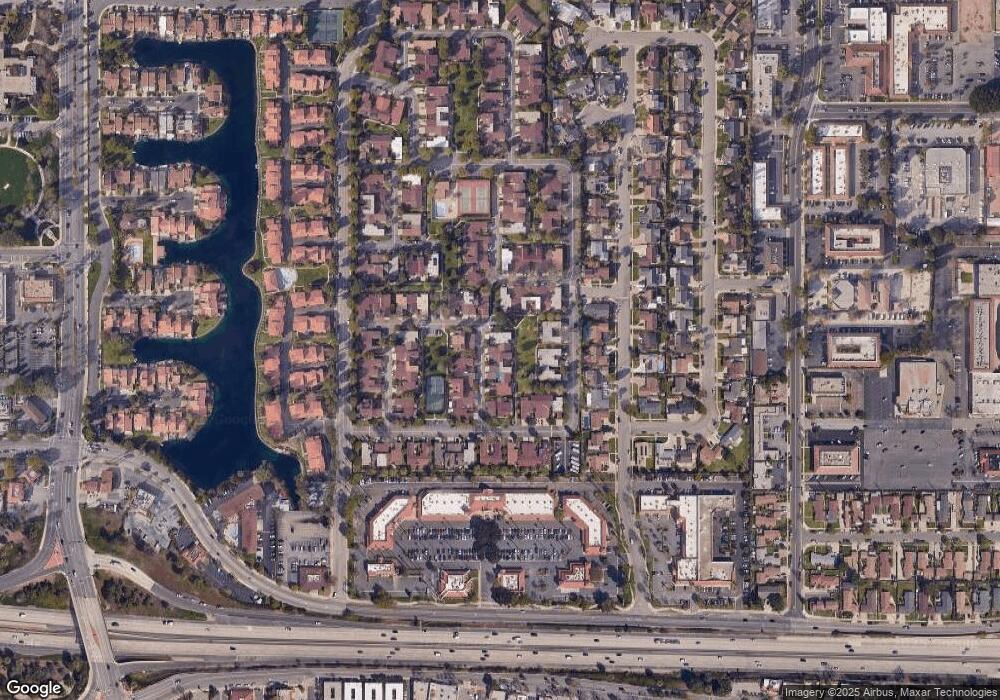
Map
Nearby Homes
- 425 Baja Ct
- 2854 Via Monte Mar
- 1610 Edgewater Ln
- 1910 Colonia Place
- 1682 Darnell Ct
- 1623 Regent St
- 0 Grandview Cir
- 1944 Hayden St
- 647 Arneill Rd
- 239 Cartagena St
- 1150 Ventura Blvd Unit 77
- 1150 Ventura Blvd Unit 95
- 1150 Ventura Blvd Unit SPC 125
- 1150 Ventura Blvd Unit 110
- 1150 Ventura Blvd Unit 62
- 2174 Wilcox St
- 1067 Bordeaux Ave
- 1143 Bordeaux Ave
- 2774 Dumetz St
- 62 + Calleguas
- 360 Capistrano Ct
- 384 Capistrano Ct
- 348 Capistrano Ct
- 336 Capistrano Ct
- 373 Capistrano Ct
- 324 Capistrano Ct
- 385 Capistrano Ct
- 361 Capistrano Ct
- 349 Capistrano Ct
- 363 Viejo Dr
- 1795 Coronado Ct
- 377 Viejo Dr
- 444 Baja Ct
- 436 Baja Ct
- 349 Viejo Dr
- 337 Capistrano Ct
- 335 Viejo Dr
- 391 Viejo Dr
- 1789 Coronado Ct
- 316 Capistrano Ct
Your Personal Tour Guide
Ask me questions while you tour the home.