
Seller's Agent in 2025
Jackie Ball Daley
Creig Northrop Team of Long & Foster
(443) 622-3022
153 Total Sales
Estimated Value: $686,836 - $773,000
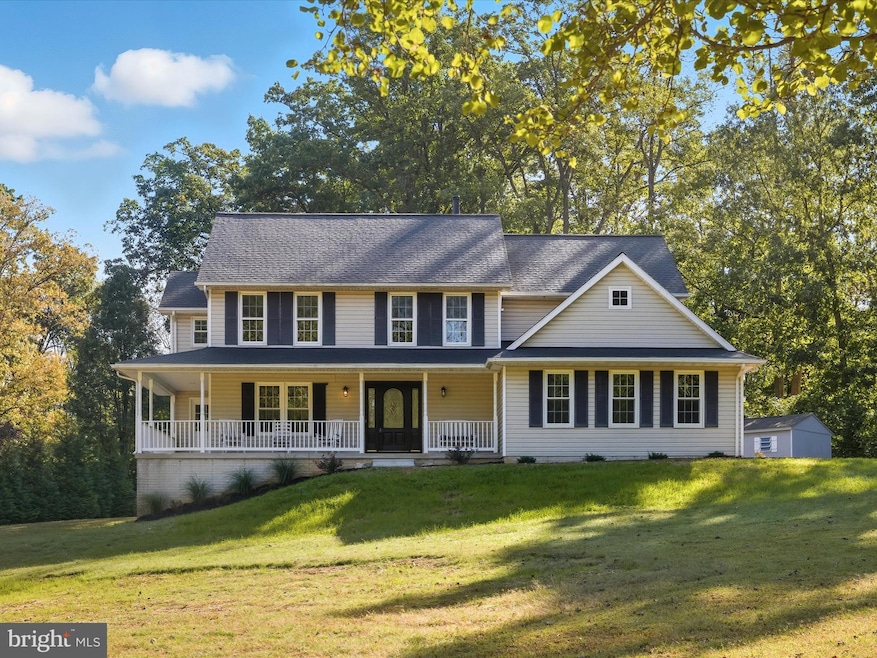
Welcome to 3720 Buffalo Road, a distinguished residence where timeless elegance meets modern comfort. Thoughtfully updated throughout, (new roof September 2025!) this home showcases wide plank hardwood flooring, plush new carpeting, and a fresh neutral color palette that enhances every detail.
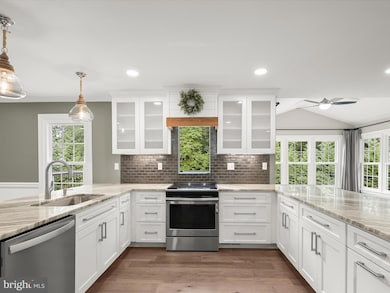
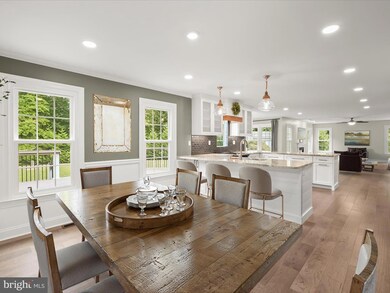
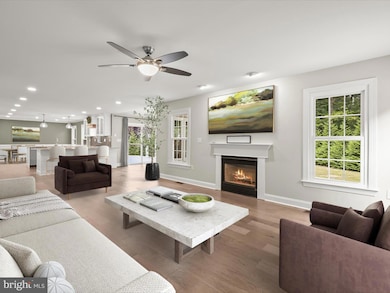
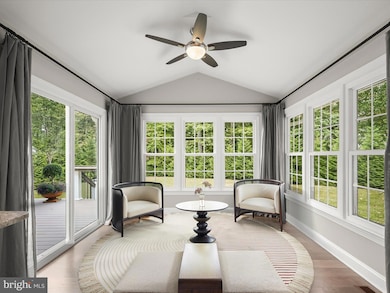
Step inside the welcoming foyer, where the living room invites gatherings to the left, while the dining room offers seamless access to the covered front porch, perfect for al fresco entertaining. The heart of the home is the beautifully renovated eat-in kitchen, featuring granite countertops, soft-close cabinetry, decorative tile backsplash, display cabinetry, and a spacious pantry. Family room, anchored by a cozy fireplace, while the adjacent sunroom with soaring cathedral ceilings and deck access creates a stunning space for both relaxation and entertaining. A stylish powder room and convenient garage access complete the main level.
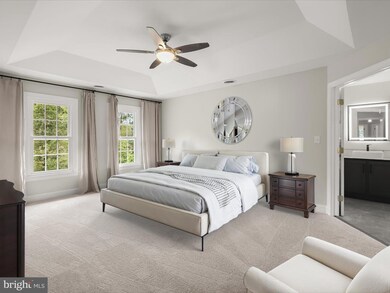
Upstairs, the luxurious primary suite is a private retreat, boasting a tray ceiling, an expansive walk-in closet, and a renovated spa-like bath with a glass-enclosed shower and elegant finishes. Three additional bedrooms, a full bath, and a thoughtfully placed laundry room provide comfort and convenience for family and guests alike.
The lower level expands the living space with a versatile game room and wet bar, a media room with sliding track doors, a bonus room, and a walkout to the backyard ideal for entertaining or unwinding in style.
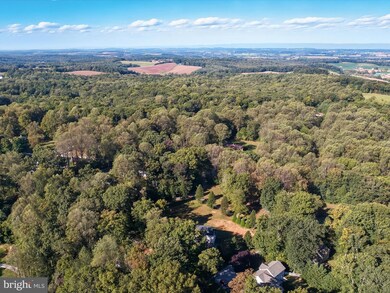
Blending modern updates with classic design, 3720 Buffalo Road offers a rare opportunity to enjoy sophisticated living in a setting designed for both comfort and connection.
Some photos have been virtually staged.
Last Agent to Sell the Property
(410) 465-1770 jackie@jackiedaley.com Northrop Realty Listed on: 09/18/2025
We collect this data history from publicly available records. To have your information removed, we recommend requesting removal directly through your county’s website.
| Date | Buyer | Sale Price | Title Company |
|---|---|---|---|
| Squires Joshua | $715,000 | Lawyers Signature Settlements | |
| Golden Tyler J | $277,224 | -- | |
| Golden Tyler J | $277,224 | None Available | |
| Deutsche Bank National Trust | $322,560 | None Available | |
| Murray Charles R | -- | -- | |
| Murray Charles R | $7,500 | -- |
We collect this data history from publicly available records. To have your information removed, we recommend requesting removal directly through your county’s website.
| Date | Status | Borrower | Loan Amount |
|---|---|---|---|
| Open | Squires Joshua | $510,000 | |
| Previous Owner | Golden Tyler J | $297,300 | |
| Previous Owner | Golden Tyler J | -- |
| Date | Event | Price | List to Sale | Price per Sq Ft |
|---|---|---|---|---|
| 12/01/2025 12/01/25 | Sold | $715,000 | -2.0% | $202 / Sq Ft |
| 10/16/2025 10/16/25 | Pending | -- | -- | -- |
| 09/18/2025 09/18/25 | For Sale | $729,900 | -- | $206 / Sq Ft |
| Year | Tax Paid | Tax Assessment Tax Assessment Total Assessment is a certain percentage of the fair market value that is determined by local assessors to be the total taxable value of land and additions on the property. | Land | Improvement |
|---|---|---|---|---|
| 2025 | $4,904 | $435,800 | $0 | $0 |
| 2024 | $4,669 | $411,600 | $183,100 | $228,500 |
| 2023 | $4,489 | $395,467 | $0 | $0 |
| 2022 | $4,308 | $379,333 | $0 | $0 |
| 2021 | $8,448 | $363,200 | $143,100 | $220,100 |
| 2020 | $4,164 | $363,200 | $143,100 | $220,100 |
| 2019 | $3,697 | $363,200 | $143,100 | $220,100 |
| 2018 | $4,189 | $368,700 | $143,100 | $225,600 |
| 2017 | $4,173 | $368,000 | $0 | $0 |
| 2016 | -- | $367,300 | $0 | $0 |
| 2015 | -- | $366,600 | $0 | $0 |
| 2014 | -- | $366,600 | $0 | $0 |
Seller's Agent in 2025
Jackie Ball Daley
Creig Northrop Team of Long & Foster
(443) 622-3022
153 Total Sales
Buyer's Agent in 2025
Kelly Steichen
EXIT Realty Center
(301) 792-6812
83 Total Sales
Source: Bright MLS
MLS Number: MDCR2029254
APN: 09-000100
Disclaimer: Certain information contained herein is derived from information provided by parties other than Homes.com. All information provided is deemed reliable, but is not guaranteed to be accurate and should be independently verified.
![]() The data relating to real estate for sale on this website appears in part through the BRIGHT Internet Data Exchange program, a voluntary cooperative exchange of property listing data between licensed real estate brokerage firms, and is provided by BRIGHT through a licensing agreement.
The data relating to real estate for sale on this website appears in part through the BRIGHT Internet Data Exchange program, a voluntary cooperative exchange of property listing data between licensed real estate brokerage firms, and is provided by BRIGHT through a licensing agreement.
Listing information is from various brokers who participate in the Bright MLS IDX program and not all listings may be visible on the site.
The property information being provided on or through the website is for the personal, non-commercial use of consumers and such information may not be used for any purpose other than to identify prospective properties consumers may be interested in purchasing.
Some properties which appear for sale on the website may no longer be available because they are for instance, under contract, sold or are no longer being offered for sale.
Property information displayed is deemed reliable but is not guaranteed.
Copyright 2026 Bright MLS, Inc.
Ask me questions while you tour the home.